How Much Do California’s City Workers Make?
With the economic shutdown devastating private sector employment in California, with small family owned businesses the worst hit, how are California’s public employees doing? A recent report by NPR paints a grim picture, “Cities Have Never Seen A Downturn Like This, And Things Will Only Get Worse.” From the San Francisco Chronicle, “California cities warn of widespread layoffs and service cuts.” And from the Los Angeles Daily News, “LA County approves deep-cut budget plan, cutting thousands of positions.”
“Layoffs and service cuts.” “Cutting thousands of positions.” Is there an alternative?
In a word, yes. California’s public employers can make the same hard choices that private employers are forced to make when confronted with declining revenue. That is, they can not only layoff employees and eliminate positions, they can also cut the pay and benefits for the jobs that remain. To the extent they do this, they can keep more of their workforce employed, and they can keep more of their services intact.
In this context, it is useful to compare the average pay and benefits earned by California’s public servants to the average pay and benefits of the people living in the various cities where they work. With pay and benefit data for 2019 now available from the California State Controller for all of California’s cities, it is possible to accurately calculate compensation averages to provide current benchmarks.
How Much Do California’s City Workers Make in Pay and Benefits?
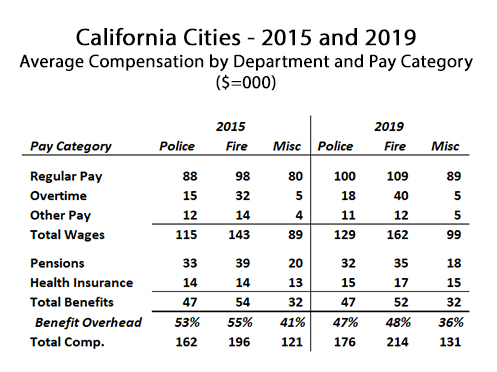
The first chart, below, shows the change in compensation in California’s cities over the past four years. As can be seen, in most categories, between 2015 and 2019 average compensation has gone up by between 11 percent and 14 percent. A notable exception to that is overtime, which is up by 21 percent for police, and 27 percent for firefighters. Another notable exception is the pension payment, which is slightly down in all three categories of employees: police, fire, and miscellaneous. The reason for this, however, is not encouraging. Starting in 2017, employers have not been required to include (ref. page 10, Step B13) the contribution towards the unfunded liability as part of an employee’s pension benefit. This merits further discussion, because the amounts are significant.
Omitting the payment towards the unfunded pension liability greatly reduces the amount of the reported pension contribution. As previously documented, employers routinely pay more towards reducing the unfunded pension liability than they pay in so-called “normal costs,” which is the amount necessary to fund pension benefits newly earned with current work. And if the “normal contribution” were ever an accurate representation of how much public employers actually have to spend to provide a retirement pension, then California’s pension funds would not have unfunded liabilities totaling hundreds of billions of dollars.
Discussing proper treatment of unfunded pension liability payments when calculating average pay and benefits for California’s city workers goes beyond the scope of this report. It would require assessing the unique liability profile of ever city considered, because, for example, there a few exceptional cities that have aggressively worked to pay down their unfunded liability. And unless literally every individual record were analyzed, active and retired, any calculations would have to rely on broad assumptions as to how much of that unfunded liability payment applies to already retired employees, and how much of the remainder appropriately ought to be included as part of the cost of an active employee’s benefits.
With respect to pensions, for this report one fact is sufficient: The average pension contribution amounts calculated are necessarily less than what these pensions are actually costing public employers and taxpayers. A lot less. This is the reason why the average pension benefit in 2019 is slightly less than the average for 2015, despite the fact that in 2018 CalPERS announced that they intended to double required pension contributions by 2024.
How Does Public Pay Compare to Private Pay in California?
It is often pointed out, with some justification, that average pay and benefits information for California’s city workers is not representative because police and firefighter compensation is included in the average, skewing it upwards. For this reason, this report shows all three rates of total compensation as separate calculations. And for all “miscellaneous” (non-safety) full-time employees working for a California city, the average rate of pay and benefits was $130,719 in 2019.
By contrast, according to the Bureau of Labor Statistics, the annual average wage estimate for all private sector occupations in California in 2019 was $61,290. Even when making generous assumptions regarding average employer benefits – 6.2 percent for Social Security, 1.45 percent for Medicare, 3 percent for a contributory 401K, and $500/mo towards health benefits – this average pay and benefits estimate still only equates to $73,817 per year.
This means that in California, non-safety city employees make at least 77 percent more than the private sector workers they serve. And in several respects, this understates the disparity. As noted, the public sector average does not include the cost to the employer of fully funding their pension benefits. It also doesn’t include the cost of pre-funding the public employee retirement health insurance benefits. And it doesn’t take into account the vast difference in average days of paid time off per year.
Normalizing for paid time off would have to include 14 paid holidays, 12 “personal days” and 20 or more vacation days as employees acquire seniority. And then there is the “9/80” program, common in California government but nearly unheard of in the private sector, where public sector salaried professionals can skip a few lunches and show up a few minutes early or depart a few minutes late each workday, and take 26 additional days a year off with pay because, every two weeks, they worked “nine hour days for nine days, then took the tenth day off.” That adds up to 72 days off per year with pay for a seasoned public sector professional.
Finally, in the public sector, the differences between “average” and “median” total compensation are negligible, with the median often actually exceeding the average. Not true in the private sector, where the impact of ultra-wealthy individuals skews the average well above the median.
For these reasons, it is reasonable to assume that non-safety public sector employees make roughly twice what private sector employees make in California. Some of this can be explained by the higher educational requirements, on average, that apply in the public sector vs the private sector. But does that disparity justify paying public servants twice as much, on average, as private sector employees earn?
Not emphasized, but worth mentioning, are the average rates of pay and benefits for California’s police and firefighters. The average full-time firefighter employed by a California city in 2019 made an astonishing 213,473, which, inexplicably, greatly exceeded the still impressive $176,226 earned by the average full-time police officer.
Often brought up in debates over public sector pay are the levels of stress and the extraordinary responsibilities confronting public servants, especially public safety employees. This is especially true at times like the present, with social unrest and a raging pandemic. This is obviously a serious concern. But the ability of public sector agencies to deliver services is heightened during these difficult times, and it is a false choice to suggest that the only options are to layoff employees and cut services.
The reasonableness of pay and benefit cuts as an option is particularly evident when comparing the situation in specific California cities.
What California Cities Pay the Most to Their Public Servants?
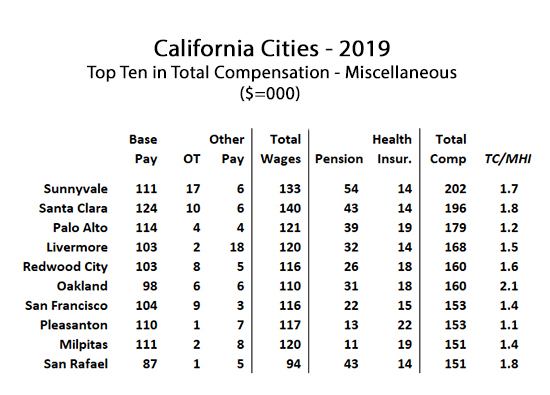
The next chart shows those cities in California that pay the most to their full-time, non-safety employees. Sunnyvale and Santa Clara, both nestled in the wealthy Silicon Valley, stand out from the pack, with the average miscellaneous worker in both cities earning around $200K per year in pay and benefits. Much of this is attributable to overtime, which typically is not out-of-control among miscellaneous employees.
The column on the far right of the chart helps put these public sector earnings into a local perspective. “TC/MHI” stands for “Total Compensation / Median Household Income,” with the median household income for each city taken into account when calculating the ratio. As can be seen, even though they serve these two wealthy suburban communities, Sunnyvale at 1.7X and Santa Clara at 1.8X have among the highest multiples.
When taking into account the fact that the difference between average and median compensation results among California’s public sector workers is negligible, whereas in the private sector, averages are pulled way up by a handful of very wealthy individuals, these multiples ought to indicate some wiggle room in terms of lowering the pay of public servants in these cities. That the comparison is between average individual earnings and median household income ought to further strengthen the case for lowering public pay instead of cutting public sector jobs and cutting public services.
Perhaps a particularly egregious example of inappropriate public sector compensation can be found in Oakland, where the average full-time bureaucrat earned base pay of $98,000 per year in 2019, in a city beset with high crime rates and myriad social problems. Imagine how much more effectively Oakland’s municipal government could cope with the challenges facing their city, if instead of paying their non-safety employees more than twice what the residents manage to earn, they lowered that ratio from 2.0X to, say, 1.5X, and put that many more people out on the streets to provide services to the residents?

When it comes to public safety compensation, it remains a mystery why California’s police officers make less than California’s firefighters. Both jobs carry similar levels of risk, but police, not just these days but historically as well, confront continuous stress as they deal with criminals and an often hostile public. Moreover, it can at times be difficult to find qualified recruits to join police departments, whereas fire departments never have that problem. With everything police are going through these days, it is difficult and arguably inappropriate to argue they are overpaid, but at the least in some California cities one must ask that question.
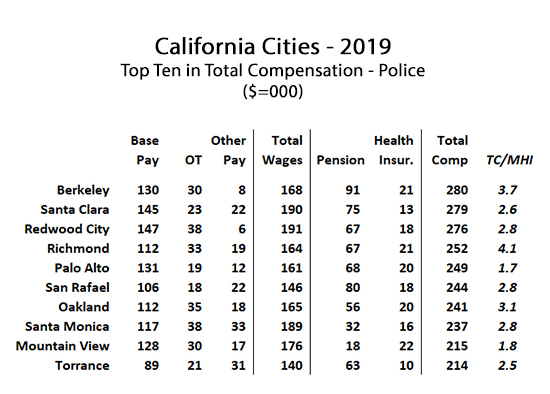
In Berkeley, for example, the average full-time police officer makes 3.7 times the median income. Notwithstanding the fact that in Berkeley, some might say the police aren’t even allowed to do their job, is it necessary for them to earn a pay and benefits package worth $280,000 per year? Many private sector critics of public pay, particularly police pay, cringe at the idea of suggesting pay cuts. But the fiscal conservatives that successfully run for local elected office are usually either well paid attorneys or prosperous businesspeople. They need to realize they are not typical; that very, very few people in private life can ever hope to earn a pay and benefits package in excess of $100,000 per year, much less $280,000 per year.
Police themselves may ask; what would it be worth to have far more members available to be on patrol? How much safer would that make both civilians and police? And what is that worth? As an aside, it has to be acknowledged that California’s liberal state legislature has made the jobs of all police in California far more difficult, with a host of laws that make it very hard to maintain public order.
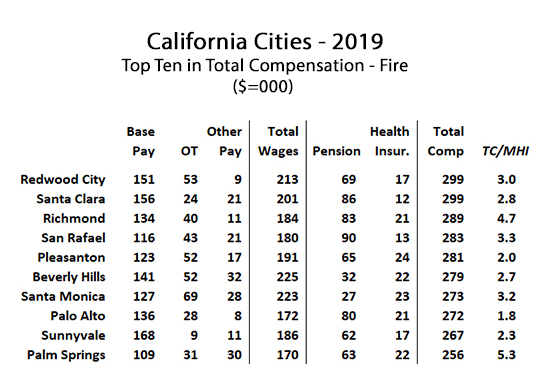
Of all the public sector jobs where rates of pay have gone completely out of control, however, firefighting has to be number one. As previously noted, the average full-time firefighter in a California city in 2019 made a pay and benefits package that cost taxpayers $214,000. And as mentioned, that amount does not take into account the full cost of paying down their unfunded pension liability, nor does it take into account the cost of pre-funding their retirement health insurance. But while the statewide average is high, the average in some specific cities is astronomical. Redwood City and Santa Clara, both Bay Area enclaves of high-tech wealth, share top spot at $299,000 each. Even more shocking is the City of Richmond, also located in the San Francisco Bay Area, where the average pay and benefits for one of their full-time firefighters in 2019 was nearly five times the median household income in that city.
Local elected officials in cities like Richmond need to ask themselves one very simple, but very tough question: If they lowered the pay and benefits package for a full-time firefighter down to $200,000 per year, would they still attract qualified applicants? What about $175,000 per year? What about $150,000 per year?
One city that has gotten their fire department costs under control is Placentia, in Orange County. They withdrew from the Orange County Fire Authority to form an independent fire department that makes use of trained volunteers, part-time firefighters, and a contracted ambulance service. They also replaced their pensions with a 401B defined contribution plan. They are saving millions, and represent a model that other California cities should consider.
It isn’t necessary to be a libertarian extremist to question the pay and benefits packages that are, now more than ever, challenging the budgets of California’s cities. In fact it would run utterly counter to libertarian orthodoxy to suggest that if pay and benefits to California’s local government employees were lowered, more government employees could be hired, increasing the effectiveness of social programs and public safety.
In California, it rarely matters if a few voters are enlightened and begin to support fiscal austerity measures such as pension reform, overtime reform, or restructuring a fire department. In general the political power in California resides with the public sector unions. These unions engage in targeted campaign spending and lobbying that is perennial and relentless, forcing all other special interests to accommodate them. This is the reason that pay and benefits in California’s cities is so much higher than what ordinary people earn in the private sector. This as well is the reason that any practical conclusion to a survey of pay and benefit packages in California’s cities must include an appeal to these unions.
What is coming over the next few years is anybody’s guess, but with the disease epidemic, the social unrest, and the economic destruction that we’ve witnessed so far, there are tough times ahead. It is in these times that public servants, particularly when they wield so much political power, must themselves decide to do the right thing. Lower wages and benefits are not easy for anyone to accept, but to make common cause with the people they serve, and to ensure the solvency of our public institutions, they are necessary.
This article originally appeared on the website California Globe.
* * *

Edward Ring is a contributing editor and senior fellow with the California Policy Center, which he co-founded in 2013 and served as its first president. He is also a senior fellow with the Center for American Greatness, and a regular contributor to the California Globe. His work has appeared in the Los Angeles Times, the Wall Street Journal, the Economist, Forbes, and other media outlets.
To help support more content and policy analysis like this, please click here.


Leave a Reply
Want to join the discussion?Feel free to contribute!