Looming Deficits Present Opportunity to Find Solutions for California

Less than six months ago, California’s state legislature approved a record breaking $300 billion state budget. Within that total, and to finance most of the state’s ongoing operations, was a general fund allocation of $235 billion for the fiscal year ending June 30, 2023.

Record breaking budgets are nothing new. Only ten years ago, California’s general fund was $93 billion, which adjusted for inflation would be $118 billion in today’s dollars. Meanwhile, California’s population over the past ten years has only grown from 38 million to 39 million. This means that inflation adjusted per capita general fund spending in California has increased from $3,124 back in 2013, to $6,023 today. California’s state government is spending twice as much money today per resident as it did just ten years ago.

This explosion in spending has yielded dubious benefits. By nearly every measure, things are worse off today in California. Obvious examples include expensive and unreliable energy and water, failing schools, rising crime, unaffordable housing and college tuition, and an exploding homeless population, but that’s hardly the entirety of the worsening challenges facing Californians. The decade-long run of record tax revenue spawned an avalanche of new regulations, driving up prices, discouraging expansion of big business and driving small businesses under. Through its spending priorities California attracts the dependent and repels anyone striving for independence. It’s grotesquely inequitable.

This is the context in which to view the latest revenue projections coming from the nonpartisan Office of Legislative Analyst. The concern here should not be that our state budget for 2023-24 now faces a potential $24 billion deficit. The concern should focus on why there has been an explosion of state spending, yielding nothing but growing dysfunction.

As it is, LAO’s projection of a $24 billion deficit is a baseline case, relying on several assumptions that could go sideways, tumbling the actual deficit into much more troubling territory. For example, LAO acknowledges the likelihood of a deepening economic recession, but does not factor the impact of a recession into their tax revenue estimate. They write, “Were a recession to occur soon, revenue declines in the budget window very likely would be more severe than our outlook.” In the section of their analysis where LAO projects worst case scenarios, they project general fund revenue dropping as low as $180 billion in 2024-25, which based on merely maintaining the current general fund budget reflects a deficit of $55 billion.

If the events of the past three years have taught us anything, it’s that consequences of pivotal events are often only obvious in hindsight. In June of 2020, did anyone really think that COVID shutting down half the economy would lead to a boom in tech company valuations? Did anyone at that time realize how uniquely beneficial the tech stock boom would be to California’s state general fund tax revenue? It’s easy today to look back and recognize the chain of causes, but it wasn’t easy to predict them when the COVID ordeal first began. It’s also easy, and probably accurate, to say that over this time period, the state legislature’s blithe ambition to make sure spending kept pace with revenue growth was blissfully unaware of just how improbable and fleeting the gift was that they were squandering.

Another lesson from the past three years, however, is to be wary of excessive pessimism. Unsustainable economic models work until they don’t work, and as long as the US Dollar is the least afflicted currency in the world and the US is the most secure investment haven in the world, and as long as inflation continues to reliably erode the principal value of a nominally exploding federal debt, massive deficit spending to stimulate economic activity may remain a viable strategy. If only more of that spending would be invested in practical infrastructure. Nonetheless, this could go on for decades. It could take forms we can only imagine. We simply don’t know.

The question therefore isn’t how to cut spending and raise taxes in order to balance the budget. The likely truth is that California’s state legislature is going to muddle through one way or another. The prevailing question should be how does California’s state legislature start to do the right thing instead of the wrong thing with all that money? They’ve doubled per capita spending in the last ten years, and ordinary hard working Californians can’t afford to live here any more. Clearly, so far they’re doing everything wrong.

LAO warnings of an impending general fund deficit are a good time to not only talk about how California’s state legislature is on the wrong course, but exactly how it can change its course. If you want to realign the state’s politics, it isn’t enough to say taxes, crime, and prices for everything are too high, and educational achievement and the supply of housing are too low. Propose concrete solutions. Very few Californians would mind paying their taxes if the state was affordable and effectively addressing the challenges of crime, homelessness, education, housing, water, transportation, energy, and education.

Solutions exist, but lack politicians with the courage to promote them and the charisma to effectively convince voters of their efficacy.

Offer state vouchers to parents to use to send their children to any accredited school, public or private.

Rescue public education by replacing woke curricula with classical education would save billions and rescue a generation from a failing system.

Fast track approval of nuclear power plants, natural gas fracking, and refinery expansions to force competition for energy and lower the prices for fuel and electricity.

Fund more water supply projects and practical freeway improvements, using tax and bond funds to yield long term economic dividends.

Approve housing developments in weeks instead of decades and reduce California’s absurdly overwritten building codes to lower the cost of housing.

Turn the timber industry loose again to thin California’s dangerously overgrown forests.

Build inexpensive minimum security facilities to incarcerate drug addicts and petty thieves to curb crime and end unsheltered homelessness. Use these facilities to teach inmates vocational skills so upon release they can fill hundreds of thousands of high paying construction jobs.

New solutions. An entire new alternative vision. This is the real discussion that California needs. Not just how to balance the budget. Rather, how to allocate the budget, and how to deregulate the economy. Where are politicians who are ready to step up with more than criticism of the failures of California’s one-party state, and offer solutions?

This article originally appeared in the California Globe.

Pension Costs Are Still Eating Government Budgets

About 20 years ago, I read an ad in a local Sacramento newspaper that said “Get a government job and become an instant millionaire.” The ad went on to describe how public bureaucrats in California enjoyed benefits private sector employees can only dream of, including a guaranteed retirement pension worth the equivalent of millions of dollars in a private 401K plan. I’d had no idea. Most people still don’t.

Pension finance, and how pension obligations affect government budgets, remains one of the most consequential elements of public policy that nobody has ever heard of. Until someone is elected to a city council, or a county board of supervisors, and sees first-hand how pension payments crowd out other budget items, the typical response to pension policy debates is one of befuddlement or indifference.

But as they say, even if you are indifferent to pensions, pensions are not indifferent to you. Also about 20 years ago, a series of pension benefit enhancements enacted by gullible elected officials, egged on by aggressive pension system managers and public employee unions, led to pension payments moving from a negligible portion of civic budgets to ravenous monsters that threatened to drive into insolvency every government agency in the state. The result has been higher taxes and fewer services, and everyone feels that.

To begin to cope with out of control pension costs, in 2013 the California State Legislature enacted PEPRA, the Public Employee Pension Reform Act, which reduced the pension benefit formulas for new government hires, and phased in a cost sharing whereby all active employees would contribute more to their pension systems via payroll withholding.

The PEPRA reform, while incremental, has helped to financially stabilize California’s public sector pension systems. But because the PEPRA reforms were primarily restricted to new hires, the savings generates will happen slowly and will take decades to be fully realized. Meanwhile, the cost to California’s cities and counties to pay their pensions has reached record highs.

To more thoroughly illustrate what California’s government agencies are up against, the following chart depicts the financial status of three representative entities, each of them a rough order of magnitude apart in size. All three are clients of CalPERS, the largest of California’s state and local pension systems, with nearly 1,700 active clients and assets that have exceeded $500 billion.

The statistics depicted below, although mind numbingly opaque to the uninitiated, nonetheless distill the financial obligation represented by pensions to a few key variables. With the exception of “Total Civic Budget” the context providing denominator offered in the final block of numbers on the chart, all of these figures come directly from CalPERS itself. For each of their clients, CalPERS provides a “Public Agency Actuarial Valuation Report.” They are highly reliable since they disclose exactly how much CalPERS intends to charge each of its clients. The data shown on the chart pertains to the 2023-2024 fiscal year, which begins in July 2023.

The first three rows of data on the above chart report (1) how much CalPERS has invested on behalf of each client, (2) the present value of how much CalPERS expects at this point in time to eventually pay out in pensions to each client’s retirees, and (3) the difference between these two values, which is the unfunded pension liability.

As can be seen (4), Santa Clara County and the City of Sacramento have only 77 percent funded pension accounts, and the City of Costa Mesa’s pension account is only 70 percent funded. Because of this, in addition to their regular ongoing payments to the pensions system to fund pension benefits as they are earned, these employers have to make catch-up payments to reduce their unfunded pension liability.

The next section of the chart depicts and quantifies these two types of contributions that agencies must make to their pension system. The so-called “Normal Contribution” (5) is how much money has to be paid to the pension system and invested each year to yield sufficient funds to eventually pay the additional pension benefits earned by active employees in that year. As can be seen (7), the employers – i.e., the taxpayers – pay about two thirds of the normal contribution. The PEPRA reform requires employees to pay half of the pension cost through payroll withholding, but, again, PEPRA only affects those hired after 2013. This means that in a few decades the taxpayer share of the normal contribution will come down to 50 percent.

The “unfunded contribution,” next on the chart (8), is what cities and counties have to pay to reduce their unfunded liability. For that amount, no employee contribution is required. The employer has to pay 100 percent of it. As can be seen, in all cases the unfunded contribution is far more than the normal contribution (row 8 compared to row 6). This means the employer share of the total contribution to CalPERS (normal and unfunded payments combined) is 79 percent of Santa Clara County’s total pension payment obligation, 82 percent of Sacramento’s, and 88 percent of Costa Mesa’s (row 10).

The impact of this burden can be put in context when considering how much these costs add to an agency payroll. The total employer payment for their pensions adds 29 percent to payroll costs in Santa Clara County, 38 percent in Sacramento, and a whopping 67 percent in Costa Mesa (11).

The Opportunity Cost

Another useful perspective from which to evaluate just how much pensions are costing taxpayers would be to consider the impact of transitioning every public employee to Social Security. At a cost to the employer of 6.2 percent of payroll, Santa Clara County would save 543 million per year, Sacramento would save $128 million, and the City of Costa Mesa would save $32 million. Why is this a far fetched scenario? Isn’t Social Security what private sector taxpayers must rely upon for their retirement security?

To take this one step further, even if along with the Social Security payment, you added an additional 6.2 percent of salary to be the employer’s contribution to each employee’s 401K – a level of generosity rarely found in the private sector – taxpayers would still save, per year, $399 million in Santa Clara County, $103 million in Sacramento, and $29 million in Costa Mesa.

It is fair to wonder how far $399 million would go towards repairing the roads in Santa Clara County, which are ranked, using data from the Federal Highway Administration, among the roughest in the nation. One might also consider how that money could be invested in more law enforcement, when violent crime has increased for the past two years in a row in Santa Clara County.

In the City of Sacramento, investing another $103 million in basic law enforcement would go a long way towards curbing violent crime in that city, where homicides were up over 30 percent in 2021 compared to 2021, and are on track in 2022 to exceed that. How many shelter beds could $103 million buy, as the homeless count in Sacramento County – most of them concentrated in the City of Sacramento – nearly doubled between 2019 and 2022? As it is, Sacramento’s projected $153 million outlay for pension contributions to CalPERS is more than they will spend on all of their capital improvement programs this year.

Costa Mesa might only save $29 million by replacing defined benefit pensions with a combination of Social Security and an exceedingly generous 401K plan, but with only 110,000 residents, Costa Mesa isn’t a very big city. The city’s general fund budget for 2022-23 is only $163 million. Saving $29 million would add 17 percent back to the city’s budget to tackle other challenges.

It is easy enough to criticize how California’s public agencies would spend the money they could save by adopting more equitable and financially sustainable retirement benefits. Current homeless policies tend to make the problem worse when more money is spent. More spending on law enforcement is wasted if criminals aren’t held accountable. Scandalous waste of public funds on road improvement projects is a perennial problem. But these examples of waste don’t obviate the fact that pension commitments have swamped civic budgets. While we’re fighting waste at city hall, we can give the savings on pensions back to the taxpayers.

Pension systems in California’s state and local government agencies today have achieved a precarious stability, thanks in part to PEPRA, and for the most part thanks to dramatically higher contributions demanded, and gotten, from taxpayers. But this stability has come at a terrific price in the form of lost opportunities for these agencies to better serve the public.

An edited version of this article was published by the Pacific Research Institute.

Tracking Political Spending by Government Unions

With a rough top-down analysis, it’s easy enough to estimate how much government unions collect and spend every year in California. They have roughly a million members, paying roughly $1,000 per year in dues. That would be one billion dollars per year. They spend about a third of that on politics. That’s equal to over a half billion dollars, every two year election cycle, that these unions can use to influence if not decide the outcome of every contest from the top to the bottom of the ticket.

If you want to know who is paying for those ubiquitous yard signs promoting some complete unknown to become the next member of the local school board, however, it gets a lot harder. If you think it’s a government union local, buying the office for a compliant candidate, you’re probably right. They’ve got the money, and they’re everywhere. But compiling a detailed assessment of government union spending at the local level in California is nearly impossible.

This matters because public agencies are relatively decentralized in California, with local government expenditures accounting for over 60 percent of total state and local spending. The only organizations that wield sufficient resources to select and support tens of thousands of local candidates every election are government employee unions. For obvious reasons these unions also have a strong incentive to find candidates they know they’ll be able to “negotiate” with for more staff, more pay, and more benefits.

Reform candidates willing to stand up to government unions quickly learn that the rules favor big money and big institutions. To begin with, there are limits to how much anyone can donate to an individual campaign. This means a candidate cannot find a political patron to back their campaign, but instead has to raise money from hundreds of donors. That’s much harder, especially at the local level. The political patron that is ever present, in every race, is the union whose members staff the agencies these elected officials will supposedly oversee.

The practical impact of contribution limits is that most viable candidacies are backed by “independent expenditure campaigns” for which there are no contribution limits. And if the candidate coordinates their individual campaign efforts with an independent expenditure campaign, they go to jail.

Contribution limits, contrary to their intent, have made it easier for big money – i.e., government unions – to dominate every small race. When a government union pours money, without limit, into an independent expenditure campaign, they exercise more influence on a candidate they support, because with independent expenditure campaigns it is the donor, instead of the candidate, who creates and defines the candidate’s identity to voters.

Another pernicious consequence of contribution limits is that by necessitating the proliferation of independent expenditure campaigns that can accept big money, it’s a lot easer to hide union money. To begin to get an idea of how difficult it is to track government union political spending in California from the ground up, monitoring every campaign, go to the California Secretary of State’s Campaign Finance website, select “Committees, Parties, Major Donors & Slate Mailers,” and enter the search term “teachers.” After you’ve eliminated the ones that are inactive and terminated, you will be staring down a list of 461 active recipient committees funded by state and local teachers unions.

Examining the reports from these 461 committees formed by teachers unions quickly reveals how little you really know. Many of the incoming contributions come from other committees; many of the outgoing donations are to other committees. It is almost impossible to track the money coming in or going out to its ultimate source or destination. Making matters much worse is the fact that only “state political campaigns and lobbying individuals and entities are required to file financial information with the Secretary of State.” Committees that restrict their activity to local candidates – and there are thousands of them – do not have to file reports on the state’s campaign finance website.

So who paid for those yard signs?

To answer this, California’s counties have stepped up to provide campaign finance information for local elections. The same challenges, however, are multiplied on these websites. Trying to decipher what donors are behind what candidates is an exercise in futility. The many transparency resources created by California’s state and county election officials are rendered nearly opaque by virtue of their complexity.

For starters, the website interfaces used by these counties are not uniform. Have a look at the campaign finance “public search” websites for San Diego, Los Angeles, Santa Clara and Sacramento counties. They’re all different. If you’re looking for information all over the state, you’ll need to learn each interface separately. In most cases, finding data on candidate controlled committees is relatively easy. But that’s not where the big money gets spent.

When it comes to independent expenditures, the complexity can become overwhelming. There is no limit on the number of independent expenditure campaigns that can be set up to influence a single race, and the contributions are reported in several different ways. For example, independent expenditures against a candidate are not reported in the same place as independent expenditures in support of that candidate’s opponent. Making matters still worse, if there is a campaign effort – a mailer, an online ad, a text or robocall campaign, a door hanger, whatever – that communicates support or opposition to multiple candidates, those expenses can show up in one place but have to be apportioned to each of the candidates mentioned.

It’s interesting to wonder what possibilities might exist to algorithmically mine California’s 58 county election reporting systems and Secretary of State Campaign Finance database to search by each candidate’s name and develop a report that identifies every donor to every committee that is either for the candidate or against their opponent. That would not be a terrifically challenging project, if California’s 58 counties used standardized campaign finance portals, and if they required candidates and committees to submit their information into a database instead of merely requiring them to upload PDF files of paper reports.

It would probably come as a surprise to many voters on the sidelines, and no surprise at all to those who have participated in state and local politics, that the vast majority of elected positions, especially at the local level, are bought and paid for by government unions. But don’t expect a comprehensive report on exactly how much was spent, in every local contest, despite that transparency residing well within the capacity of existing technology.

Without better information on the sources of campaign contributions, it is still informative to simply visit a candidate’s website and see who is endorsing them. If a candidate is endorsed by government unions, you can be pretty sure who bought those lawn signs.

This article originally appeared in the California Globe.

Can’t Afford California? Thank an Environmentalist

The world that we invented, from an environmental perspective, is now getting in the way of moving these projects forward.
– California Governor Gavin Newsom, August 11, 2022

This moment of candor, coming from a man who seems determined to be the most environmentally correct politician in the world, was with reference to water projects. But Newsom, and anyone else paying attention to California politics, knows that for every major project, of whatever type, environmental regulations and litigation are getting in the way of moving them forward.

That’s life in California, and when even Governor Newsom starts to complain, you can bet the problem is real. Environmentalism run amok isn’t just stopping infrastructure projects and destroying economic opportunities for millions, it’s even harming the environment.

That isn’t hard to miss, if you look around. Notice the dead or dying trees in front of homes, businesses, or in the traffic medians on the boulevards of major cities? Thank environmentalists, who for decades have successfully blocked any projects that might have drought proofed our water supply and eliminated the need to triage urban water use.

Are you sweltering in neighborhoods adjacent to fields turned into heat islands, where toxic plastic rugs have replaced natural turf, supposedly to save water and hence save the planet? Are your kids coming home with torn ligaments and synthetic particles embedded in their skin and clothes, because they competed on these fake lawns? Thank an environmentalist.

Have you been forced to burn LED lights, all of them equipped with cheap transformers, and noticed the unhealthy impact of spending half your life exposed to their oscillating flicker? Wouldn’t you prefer to have access to the newest warm, safe energy-efficient incandescent bulbs instead of having them banned? Thank an environmentalist.

Are you using battery powered blowers, mowers, pruners and weed whackers that are clearly not ready for prime time? Do you enjoy having to obsessively charge and discharge them and store them according to demanding specifications so they don’t burn out after six months? How’s that working out for you? Thank an environmentalist.

Have you been stranded in your EV, waiting for an hour or more to get to a charger and get recharged? What do you do when it rains so hard it’s hazardous to charge an EV, or when you can’t find a charging station, or you don’t have hours to wait to add range to your car?  Someday, EVs may be practical, safe and affordable. But why are they being forced upon the public today? Thank an environmentalist.

None of this stuff helps the planet. There ought to be plenty of water and energy to allow Californians to live with comfort and dignity, but instead of building enabling water and energy infrastructure, sue-happy environmentalists stop every project in its tracks, while their cronies profit from sales of marginal products that use far more resources and ultimately leave a bigger environmental footprint.

Does anyone really think astroturf, or LED lights, or lithium batteries, can be “sustainably” manufactured and recycled? What about thousands of square miles being smothered with photovoltaic cells, wind turbines, and battery farms? What about electric vehicles? In most cases, the manufacture, impact, and maintenance and replacement requirements of “renewables” consume orders of magnitude more resources than conventional energy.

In California, the entire economy is critically damaged thanks to extreme environmentalism, starting with housing. In the old days, homes were built with lumber that was logged and milled in California. Water heaters, cooktops and space heaters used natural gas extracted from California wells, and electricity came from an in-state mixture of hydroelectric, natural gas and nuclear sources. Water came from a system of reservoir storage and interbasin transfers via aqueducts and pumping stations that remains a marvel of the world. The new roads and freeways were constructed out of a combination of government operating budgets and bonds. The land homes were built on was rezoned without litigation or onerous delays and fees.

On this foundation of government funded enabling infrastructure and less regulations, homes were affordable. Back then, California worked for ordinary people. It became a magnet for people from all over America and the world. Those days are gone. Thank an environmentalist.

There’s a reason homes cost almost twice as much in California as they do in the rest of the nation. Getting land approved for development takes years if not decades, during which at any point the permit can be denied by any number of agencies or deterred by endless environmentalist litigation. On top of land scarcity is water scarcity, also politically contrived, which prevents many housing developments from even being proposed.

Then there is the cost of lumber and concrete, products that used to come from local sources that competed for customers. But with California’s lumber harvest down to a quarter of what it was only 30 years ago, and the virtual impossibility of opening new quarries, home builders have to import their materials from other states and nations, driving costs way up.

Adding to the cost of homes as well are the environmentally-correct appliances now required, that are energy and water efficient to a fault. Equipped with sensors, software that requires updates, and connected to the internet, these hyper-efficient machines cost twice as much as they otherwise would, don’t last very long, and do a poor job. And what about those “low flow” faucets and shower heads that barely release water, and turn off automatically before you’re done with them?

There’s nothing wrong with designing greater efficiency into appliances. But these appliances go well beyond the point of diminishing returns, and the only beneficiaries are crony manufacturers and tech companies. Thank an environmentalist.

The counterproductive impact of environmentalism defies reason. It’s not just the colossal, destructive footprint of supposedly renewable products or sources of energy. It’s land management. Thanks to environmentalists, in California’s forests and woodlands , in order to log, graze livestock, do controlled burns or mechanical thinning, property owners confront an obstacle course of regulations and permit requirements coming from several agencies at once. Many of the regulations are in conflict with others; it is an expensive and protracted process that very few can navigate. And so the overcrowded forests burn.

This is perhaps the most egregious example of counter-productive environmentalism. Bigger than their war on nuclear power and natural gas. Maybe even bigger than their success in making California unaffordable and inconvenient for all but the super rich. For the last 30 years, as CalFire snuffed out every small fire they possibly could, every practical means of thinning the forests to compensate for fire suppression was made nearly impossible. Thank an environmentalist.

California’s forests are approximately seven times as dense as they have historically been for millennia prior to these atrocious circumstances. In previous centuries, because they weren’t overcrowded, the forests survived droughts more prolonged than the ones we experience in this century. But today, the rain we get can’t even percolate into the ground. The crowded trees desperately absorb every drop, and it still isn’t enough, because where one tree used to grow, seven trees are competing for the same nutrients and moisture. This is why the trees are dying. This is why we have superfires.

When California’s forests have burnt down to the dirt, and ash laden silt is eroding into every stream and river in the state, thank an environmentalist.

It should go without saying that environmentalism is an important value to incorporate into public policy. We may thank environmentalists for getting the lead out of gasoline, and saving the majestic Condor, to name two noteworthy achievements that happened right here in California. But environmentalism becomes a negative value when its primary benefit is only to line the pockets of environmentalist litigants or pad government bureaucracies or enrich crony businessmen.

Today there is no balance. Environmentalism in California is out of control because it empowers a powerful coalition of special interests. The interests of the planet, as well as the interests of California’s striving humans, have become secondary. Newsom’s criticisms are helpful. Now they need to be followed up with action.

This article originally appeared in The Epoch Times.

Are Government Pensions Funds in Crisis Again?

If ever there were a case of Chicken Little, it’s the endless squawking over the imminent implosion of public employee pension funds. In California, ever since pension benefits were enhanced, retroactively, starting in 1999, critics have been claiming a pension apocalypse was imminent. But no matter what happens, pension funds muddle through.

The modern era of pensions began in the 1984, when pension system guidelines were revised to permit them to purchase equities without limit. By 1999, on the strength of a nearly 15 year run of unbroken equities growth, California’s pension systems were fully funded with surpluses. With their confidence undiminished after the internet bubble popped and stocks tanked, pension system managers blithely continued to advocate pension benefit enhancements. By 2005 those benefit enhancements had rolled through every agency in California, and by then the markets were recovering as well. Then came the crash in the fall of 2008. To cope, the pension systems began to use creative accounting. Collectively these gimmicks obscured growing problems.

For example, asset “smoothing” made it possible to hide recent drops in the value of invested assets by reporting the average value of those assets over previous years. As the funded status – the difference between total invested assets and the amount the fund actually needs to pay current and future pensions – worsened, pension systems began to require so-called “unfunded contributions,” which were catch up payments necessary to reduce the growing amount of underfunding. But by negotiating repayment terms analogous to negative amortization mortgages, agencies were allowed to make low payments in the early years of the amortization term, which frequently meant the underfunded amount wasn’t even being reduced. Then when those payments become burdensome, agencies would refinance the new, now even larger unfunded liability, to get that unfunded payment down again.

Gimmicks abounded. Pension funds in the early 2000s used an estimated rate-of-return per year of around 7.0 percent, which was obviously too high, since the funding status of pension systems continued to worsen. But by maintaining the fiction of a higher than realistic rate-of-return, pension systems could underestimate the size of their pension liability, and claim there was enough money in the system. If they acknowledged that returns might be lower, they would need more assets to make up the difference.

The consequence of this was pension systems quietly ended up with an unfunded payment that came to dwarf the “normal” payment. If a pension system is fully funded, the only contribution required each year is the “normal” payment, which is the amount of money that has to be invested in order to pay whatever amount of future pension benefits were earned in that year. This is the essence of pension finance. You estimate the present value of future pension benefits, and make sure you have that amount invested today. When you don’t do that, you end up with an unfunded liability. In California today, in almost every one of the pension systems set up for government retirees, the unfunded payment that agencies have to make to the pension systems is now more than the normal payment. But guess what? The only portion that public employees have to themselves help pay through payroll withholding is the normal payment. Taxpayers pick up everything else.

If all this complexity is tedious, join the club. An innumerate legislature, a powerful public employee union lobby, and inadequate pension system oversight has put us where we are today. Pension systems that remain only 70 percent funded, with taxpayers footing far more than their share.

So are we today at just another Chicken Little moment? After all, the pension systems have bent but they never broke. This is thanks to the PEPRA reforms of 2013, the GASB reforms of 2015, along with agencies picking up unfunded contributions that slowly grew into the monster they are today, which allowed them time to raise taxes and cut services so they could make those higher payments.

Taking all this into account, it is not unreasonable to consider government pensions resilient enough to take whatever is coming next. Nonetheless, with today’s uncertain outlook for stocks, bonds, and real estate, it is timely to have another look at the financial health of California’s pension systems. Since CalPERS is the 800 pound gorilla in California’s pension jungle, a look at its finances may be illustrative.

The first chart shows the funding status of CalPERS by year, starting with the fiscal year ended 6/30/2007 and continuing through 6/30/2020, the most recent year for which financial statements are available. As can be seen, CalPERS has only been around 70 percent funded for over six years. It is also evident that 2013 was a pivotal year for the fund, because in that year, the value of the total invested assets actually declined, from $283 billion on 6/30/2012 down to $281 billion on 6/30/2013. The funded ratio prior to 2013 had stayed over 80 percent, but subsequently fell down into the 70s and still has not recovered.Something else that should be noted from this first chart is the relentless growth of the pension liability. Between 2012 and 2013, as total investment assets shrunk in value, the present value of future pensions increased by over 10 percent, from $340 billion to $375 billion. Overall, during the 14 years reported here, while assets increased in value by 181 percent, liabilities increased by 223 percent. The combination of absolute growth in the total pension liability and a diminishing funded ratio has a compounding impact on the amount of the unfunded liability. As of 6/30/2020, CalPERS was facing an unfunded liability of $163 billion. Taxpayers are on the hook for 100 percent of this debt.

While complete financial statements for CalPERS – and most public employee pension systems – lag about 18 months behind their close dates, every month CalPERS offers an update on the value of their invested assets. Reviewing the latest available report reveals the risks they have begun to take in order to prevent their funded ratio from further deteriorating.

The next chart, below, provides a snapshot of CalPERS investments as of August 31, 2022. Their total assets have swollen to $446 billion. That’s good performance, implying an annualized return over the 14 months since 6/30/2020 of over 9 percent. But what’s in these numbers?Here is where CalPERS position may be more precarious than ever. Consider each category of assets, including some you would not have spotted ten years ago. Public equity refers to listed stocks, and with the market in turmoil, the direction of these investments is uncertain. “Income” refers mostly to bonds with fixed yields, and as interest rates go up, the value of previously purchased bonds must fall, since for them to remain marketable the yield from their fixed payment has to rise to a competitive level. “Real assets” refers to real estate investments, which, like publicly traded stocks, is in uncertain territory. But what about the other categories?

Here is where even greater risk to the CalPERS investments may reside. Private equity and private debt refer to investments in companies that are not yet listed. These investments lack the liquidity of publicly traded stocks and bonds, and the financials of these companies are not as transparent. Private equity may also include hedge fund investments which are even more volatile.

And then there is “Other Trust Level” investments, where CalPERS has deigned to commit over $16 billion. In the footnotes to CalPERS Trust Level Quarterly Update, decipher this description: “Trust Level Financing reflects derivatives financing and repo borrowing in trust level Synthetic Cap Weighted and Synthetic Treasury portfolios.” Good luck with that. This is pre-financial crisis speculative behavior, the sort that almost brought down the entire financial system. To further put this in context, “Leverage” refers to money CalPERS borrowed in order to make additional investments, hoping those investments would earn more than they paid to borrow the money.

A financial blogger operating under the pseudonym “QTR” (Quoth the Raven), with thousands of subscribers on Substack, warned last week what could happen to U.S. pension funds, writing “The fact that these funds were unable to post the returns that they needed during arguably the most euphoric bull market in history is extremely concerning.”

If CalPERS is any example, indeed they could not. During the period from 2007 t0 2020, CalPERS went from 87 percent funded to 70 percent funded. Because annual pension benefit payments to government retirees in California are required to match inflation once the purchasing value of a pension falls to within 75-80 percent of its purchasing power upon retirement, inflation is going to drive the amount of the total pension liability up faster than the 6.4 percent it averaged over the past 14 years. CalPERS, and the other pension plans, are chasing a greyhound, and the engine is overheating.

California’s pension systems, to the extent they have matched CalPERS in diverting billions of dollars into private debt and equity, hedge funds, derivatives, and other highly speculative financial instruments, and financed these adventures with borrowed money, are stretched as far as they can go. California’s legislature needs to investigate the asset mix of state and local government pension systems and honestly appraise the exposure. Are they facing margin calls? Do they face liquidity risk?

As for the financial experts running California’s pension systems, they need to back away from speculative investments, deleverage, and tell the union lobbyists and their captive legislators the truth: We can no longer use creative accounting and high-risk investment strategies to perpetuate the perception of system stability.

This article originally appeared in the California Globe.

Why the Middle Class is Being Destroyed

Nearly 30 years ago, Richard Herrnstein and Charles Murray published “The Bell Curve,” which became notorious for its chapter that highlighted differences in IQ test results by race. But that controversy overshadowed the primary focus of the book, which was that the human race is dividing into a cognitive elite and everyone else.

In the book, the authors argue that for the first time in history, humans are far more likely to marry their intellectual equals. “As the century progressed,” they write, “the historical mix of intellectual abilities at all levels of American society thinned as intelligence rose to the top. The upper end of the cognitive ability distribution has been increasingly channeled into higher education, especially the top colleges and professional schools, thence into high-IQ occupations and senior managerial positions. The scattered brightest of the early twentieth century have congregated, forming a new class.”

Herrnstein and Murray went on to predict an alliance between the cognitive elite and the affluent, writing, “For most of the century, intellectuals and the affluent have been antagonists,” but that now, “the very bright have become much more uniformly affluent than they used to be while, at the same time, the universe of affluent people has become more densely populated by the very bright. Not surprisingly, the interests of affluence and the cognitive elite have begun to blend.”

Although parts of The Bell Curve have been hotly debated, these two predictions—the formation of a cognitive elite, and the alliance of the cognitive elite with the affluent—resonate strongly today. They explain one of the root causes of globalism. Herrnstein and Murray even predict the rise of “the custodial state,” which they define as “a high-tech and more lavish version of the Indian reservation for some substantial minority of the nation’s population, while the rest of America goes about its business.”

The problem with that prediction, however, is that it suggests America will divide into three classes: the cognitive elite and affluent class, the middle class, and a permanent underclass of the cognitively deficient, completely dependent on the “custodial state.” That would have been bad enough, but that’s not quite what is happening. Instead, the elites in America, joining with their counterparts in most of the rest of the developed world, are engineering a future where there will only be two classes: the elites and a permanent underclass.

Not everyone who is highly intelligent or independently wealthy embraces the extreme climate and equity agenda. Many still see that such a flawed agenda is bound to impoverish and embitter billions of people. While there are powerful incentives to go along, and powerful disincentives to resistance, minds can be changed. The prevailing consensus can be broken.

To avoid turning the vast majority of humanity into livestock, which is where we’re headed, requires presenting alternative scenarios. Appealing to those elites who retain a shred of common sense and common decency is not impossible. Protecting the planet and promoting fairness does not require rationing and racism. Elaborating on those basic facts may yet convince a critical mass of elites to change the course we’re on.

Meanwhile, to try to fully understand the reason America’s elites are distancing themselves from everyone else, and engineering the destruction of the middle class, another curve has explanatory value: the curve of population growth in the world.

After a few millennia of slow growth, the human population began to skyrocket. Rising from 190 million in the year zero to nearly 1 billion by 1800, by 1928 it had doubled to 2 billion, hit 3 billion by 1960, and then added another billion every 15 years. World population now stands poised to break 8 billion within the next year or two.

You don’t have to be a member of the cognitive elite to see the human population cannot continue to double every 40 years indefinitely. And it won’t. Several possible causes have been identified to explain the relatively recent and steady reduction of birthrates around the world, but the decline is indisputable. Humanity most likely will reach its peak population within a few decades, if not sooner, after which the total human population will be aging and shrinking. How fast it will shrink, and what that will look like, though, brings us back to the role of the elites.

Herrnstein and Murray in their predictions and prescriptions for Americans coping with the rise of a financial and cognitive elite didn’t take into account global population demographics. They also didn’t anticipate the rise of the green movement as a moral pretext for the destruction of the middle class.

The elitist argument for destroying the middle class is simple. If everyone on earth used as much energy as Americans use, global energy production would have to more than quadruple. That fact roughly applies to all natural resources. We might argue—and we should argue—that innovation can deliver a middle-class lifestyle to 8 billion people without catastrophically depleting critical natural resources or causing unacceptable harm to the earth’s biosphere, but apparently that’s not a choice the elites want to make. And they don’t have to.

Explaining this refers to another development, the full impact of which Herrnstein and Murray couldn’t have seen coming, which is how artificial intelligence and other technological innovations will make the existence of a middle class unnecessary.

In their book, Herrnstein and Murray ask, “what is the minimum level of cognitive resources necessary to sustain a community at any given level of social and economic complexity?” By implication, they suggest that if the average IQ of a population is low or in decline, that jeopardizes the potential of the population to advance or even maintain their standard of living. But the consensus among today’s elites is that broadly distributed intelligence in a population is no longer necessary.

The logic for this is sound, even though it dismisses the aspirations of billions of people. People in jobs of moderate responsibility, or less, won’t need to know as much or think as much as they once did. Even doctors and airline pilots will rely increasingly on algorithms to make their diagnoses and fly their planes. If the plane crashes, as we saw a few years ago with two grisly 737 incidents, that is an inevitable byproduct of working out the bugs in the software. If a cyber attack systematically crashes the entire civilization, the elites will be in their bunkers, sandboxed away from the ensuing mayhem.

What is coming is a ruthless meritocracy that will admit only those individuals with the skills to do work that can’t be replaced by algorithms and robots. There won’t be many openings. In most professions and trades, to the extent human involvement is still necessary, competence will be secondary to affirmative action because automated procedures and artificial intelligence prompts will tell workers what to do.

By blending and flattening the population of the world’s cognitively normal, the cognitive elite will be able to pacify and manage them, distance themselves, and have exclusive access to whatever property and privileges they consider not sustainable or desirable for everyone to enjoy.

For example, even if it becomes possible to deliver a middle-class lifestyle to the entire global population of aging billions, the elites may ask, “Is it desirable?” And if it becomes possible to deliver life extension therapies inexpensively with nothing more than a gene modifying injection, the elites may also ask, “Is it desirable?” Why should elites care about any of this if an underclass of machines that do not require these things can do all the work for far less bother than an underclass of humans?

Meanwhile, the ongoing expansion of the custodial state is concurrent with the average IQ of Americans shifting into decline. This shouldn’t be surprising. The so-called Flynn Effect, the theory that social and economic progress caused IQ scores to rise in the early 20th century, has now been thrown into reverse. Many factors could explain this reversal, but because it is happening universally, we might start by implicating a degraded system of public education, a dumbed-down media, the diversions of mindless, endless online rubbish, the collapse of meritocracy, and the replacement of the pursuit of excellence with the quest to acquire status and rewards by defining oneself as a victim.

The controversy over one chapter in Herrnstein and Murray’s book should not diminish the fact that, way back in 1994, their work anticipated two of the most decisive trends in the world today: The emergence of a cognitive elite, and, for the first time in history, the almost total convergence of intellectuals with the financial elite. The consequence, an apparent consensus among the two groups to destroy the middle class to protect their own interests while claiming they’re saving the planet and promoting “equity,” should surprise nobody.

It’s the easy path. But it’s the wrong path.

This article originally appeared in American Greatness.

Manhattan Beach Firefighter Average Pay $328K Per Year

Negotiations between the Manhattan Beach Firefighters Association and the Manhattan Beach City Council have been stalled since May, when an impasse was announced. As reported in a local publication serving Manhattan Beach and nearby cities, firefighters and their supporters packed a July 19 city council meeting to urge the council to alter its stance in labor negotiations.

In the article, “Firefighters from Manhattan Beach and their supporters storm City Hall,” some of the firefighter union’s positions were noted. One of them was for the firefighters to receive “the same cost of living salary increases the other city unions received over the last 3.5 years, a period during with MBFA has not received an increase.”

In that regard, it would be useful to report what full time firefighters with the Manhattan Beach Fire Department earned in 2021, using data downloaded from the State Controller’s website.

A few things should be called out in the above chart. First – the employee compensation data the City of Manhattan Beach reported to the State Controller did not include any allocation of the payment the city makes towards the unfunded pension liability. This means the numbers you see in the “pension” column are for the so-called “normal cost” and therefore no argument can be made that they are inflated. One could make the argument that since no allocation whatsoever is made to active duty firefighter compensation to account for the city’s substantial unfunded pension debt, the average per firefighter pension costs reported here are understated. But that’s material for another story.

Next, the context in which Manhattan Beach firefighters claim they have not received cost of living increases commensurate with what other city unions received over the last 3.5 years might reasonably include how much firefighters earn in other cities. Here, using 2020 data, is average compensation for full time firefighters in the 25 largest city departments in California. The yellow highlighted top four all include payments on the unfunded pension liability in their reported data and therefore probably overstate the total compensation. As can be seen, however, even taking that into account, only one city, Santa Clara, reports total compensation in excess of Manhattan Beach. None of the other cities are even close. This data is one year old, but it is a safe bet that Berkeley, for example, did not increase its total firefighter compensation by 28 percent ($71,000) in one year [(328/257)-1].

Finally, what stands out with respect to Manhattan Beach firefighter compensation is the large amount of overtime they’re earning, $94,000. None of the major cities have anything close to that in overtime expense. Why is this?

In a letter the City Council released on July 19, the city attempted to explain this, writing:

The Firefighters’ Association has repeatedly stated they receive overtime for hours worked beyond their normal hours. This is not true. Just because a firefighter receives overtime does not mean they are working time over their regularly scheduled hours. For example, a firefighter can be on vacation for two shifts but work another shift in the same week and receive overtime. Similarly, two firefighters can work each other’s vacation shifts and receive overtime without working any additional hours. This is because vacation, holiday leave, and injury pay count as “hours worked” to qualify for overtime.

One of the City’s proposals to reduce overtime addresses the current system in which every shift taken as leave is automatically backfilled with overtime by allowing shift trades (two firefighters working for each other). This proposal allows employees to take the same amount of time off while reducing the payment of time and a half overtime when firefighters are not working any additional hours. This, in effect, limits the number of shifts that will be backfilled on an overtime basis. The City is also proposing to remove the ability to convert unused sick leave into vacation, which creates further backfill of overtime. The Association has not agreed to these simple provisions because it will reduce the amount of overtime pay they receive.

In plain English, what the city council is saying is that Manhattan Beach firefighters game the rules to collect overtime even though they aren’t working extra hours. It is reasonable for the city council to attempt to rewrite the rules so this will stop.

Compensation and benefits for public safety personnel is a fraught topic, and hyperbole does nothing to foster constructive outcomes. How much should a firefighter make? It’s fine to throw out statistics that prove the average life span of a retired California firefighter is actually somewhat greater than that of the public at large, or that statistically, a cashier behind a liquor store counter is more likely to die on the job than a firefighter. But that fails to take into account the fact that a horrific conflagration, such as the World Trade Center bombing, could alter those statistics overnight, and firefighters go to work with that knowledge every day. Liquor store clerks, as we have learned, provide essential services, but they’re not the ones who come running to help when our house is burning down, or a family member is having a medical emergency.

Using statistics also can overlook the fact that the value of life has never been so precious. A century ago, disease, war, and accidents claimed lives with such frequency that death was a normal part of life. Today, especially in a city as wealthy as Manhattan Beach, death is never routine. Citizens therefore have never had higher expectations of their fire departments than they have today, and better service is going to cost more. Unfortunately, this makes it hard to argue with a firefighter who is a member of the community and believes they deserve a raise. But in Manhattan Beach, with respect, they don’t.

Firefighters that collect a pay and benefits package in excess of $300,000 per year are not underpaid. Maybe they can’t afford a home in Manhattan Beach. But that’s because nobody can afford a home in Manhattan Beach. Maybe it’s gotten harder to recruit firefighters. But that’s because it’s gotten harder to recruit anyone to take jobs in recent years.

Firefighters in Manhattan Beach should ask themselves: Is my job harder than one in San Diego, where the average firefighter pay and benefits package is less than half what it is in Manhattan Beach? Clearly it’s not. Work through a Saturday night in downtown San Diego, and compare that to working the night shift on a weekend in Manhattan Beach. There are over 30,000 full time firefighters in California. To pay all of them what firefighters make in Manhattan Beach, instead of what firefighters make in San Diego, would cost taxpayers $4.5 billion per year.

Maybe Manhattan Beach firefighters, along with the unions representing firefighters in other cities, might reconsider their involvement with organizations that are destroying the quality of life in California. They might reconsider their political alliance with leftist unions such as the CTA, or the leftist California Labor Federation headed by Lorena Gonzalez. Maybe they should consider using their political power to create jobs and opportunities in California by supporting legislation that helps small businesses and rolls back extreme environmentalist regulations. If they did that, maybe we could lower the cost of living in this punitively expensive state. Doing that would mean everyone, in effect, would get a raise.

This article originally appeared in the California Globe.

Inflation adjusted per capita state spending doubles in one decade – for what?

The California State Legislature has just released the “Floor Report of the 2022-2023 Budget,” and it’s a doozy. Representing an agreement between the budget committees of the Assembly and the Senate, and building on Governor Newsom’s proposal, this $300 billion monstrosity has moved one step closer to becoming final.

To fully appreciate how out of control California’s state government spending has become, compare the general fund spending growth over just the past ten years. The following chart, relying on official state budget reports going back to 2012-13, shows California’s General Fund spending by year. Back then, the general fund was $92.9 billion. Adjusting for inflation and expressing this amount in 2022 dollars, the 2012-13 general fund was $118.4 billion, barely half the swollen $235.5 billion that is projected for the upcoming budget year.

When you take into account the fact that California’s population has only increased by 3.1 percent in the past decade (it’s actually declined for the past two years), this budget profligacy becomes even more inexplicable. The inflation adjusted (i.e., in 2022 dollars) per capita general fund spending ten years ago was $3,124. It has now exploded to $6,023 per person. What has the average Californian gotten for all that extra money, apart from taxes that are higher than ever, and set to go even higher?

By almost every objective measure, Californians are worse off today than ten years ago. Back in June 2012, the average cost of a home in California was an already outrageous $307,000 ($391,000 in 2022 dollars). As of June 2022, the average cost of a home in California is just over $800,000.

Every basic necessity in California costs more: gasoline, electricity, and water. The only commodity where Californians still pay prices competitive with the rest of the U.S. is for fruit and vegetables, but regulators are fast closing in on that last advantage. Just ask a farmer that’s trying to get water allocations from a state bureaucracy committed to letting every precious drop of rain in these dry years run out to sea. And they’re doing this during a global food crisis.

What about crime? Homelessness? Is California better off today than it was ten years ago? Drive down any urban boulevard, or up any freeway onramp, and survey the expanse of tents and makeshift shacks. Did you see that ten years ago? The state’s answer? Turn tens of billions of dollars over to developers and “nonprofits” to build “permanent supportive housing” at an average cost of $500,000 per unit. These unfortunate souls could easily be rounded up and given inexpensive shelter, and required to maintain sobriety, and if that happened they’d either go back to Arkansas, or they’d finally have a chance to recover their dignity. Instead, while the homeless industrial complex scams taxpayers for additional billions, they frequent “safe injection sites” while living in squalor.

What’s happened in California, and it’s being exported to the rest of the United States, is an out-of-control public sector has imposed a regulatory burden on businesses that has driven prices up, destroying small businesses, and enabling big corporations to consolidate markets.

Excessive building codes and permitting fees are a perfect example. Builders in California are required to comply with so many mandated construction codes, and obtain so many permits, from so many agencies, that only the biggest and most politically connected development corporations can still make money. Smaller operators are driven out of the business, not only including the smaller construction companies, but mom and pop landlords. As these barriers fall into place, entire neighborhoods are bought up by investment funds. Thanks to the crippling burden of regulations, the last avenue towards building generational wealth in California, real estate, has been taken away from all but the wealthiest families.

This is the story of California in the early 21st century. A voracious state government has created shortages and high prices through overregulation, then as people are impoverished by its actions, it has used that to justify expensive new programs and expanded state bureaucracies. Failed policies, for California’s state government, constitutes success, as taxes are raised and even more regulations are enacted to cope with the problems it created.

No wonder the inflation adjusted per capita state General Fund spending has doubled in the past decade.

This article originally appeared on the website of the California Policy Center.

ESG Investing and Public Sector Unions

For the last few decades what used to be referred to as socially responsible investing has more recently morphed into “ESG” investing. The acronym stands for “environment, social, and governance,” and refers to how investors should evaluate the impact that every company they’re considering investing in has, positive or negative, in those three areas.

ESG investing has rapidly become a mainstream priority in the financial world. This year, the Securities and Exchange Commission is likely to mandate ESG disclosures for publicly traded U.S. companies. Reporting ESG scores is spreading as well to EuropeCanadaAustralia, and elsewhere.

The implications of formalizing ESG reporting are intended to transform the global economy. Companies with low ESG scores will not only be subject to institutional divestment, which would itself constitute a serious threat to their ability to do business. They can also be denied access to lines of credit and other banking services, and they can end up unable to purchase insurance coverage.

The scope of what ESG deems objectionable is vast and inevitably subjective. It can implicate companies that may only involve a small fraction of their operations in the frowned upon activities. The allocation of low ESG scores is impacted by the corruptibility of the examiners and the criteria for ESG scoring may in many cases rest on premises that are either false or transient. With all that in mind, here some examples of activities that will draw a failing ESG score:

Alcoholic beverages, tobacco, commercial animal husbandry for food production or animal testing, military equipment, civilian firearms, gambling, private prisons, adult entertainment, oil extraction, production, and refining, coal distribution and coal fired generation of electricity.

Observing this list, it should be immediately obvious that none of these objectionable categories are going to suddenly vanish. They represent sectors that are too huge, contributing services which are either vital (food, energy, security), or for which there is an irrepressible demand (alcohol, tobacco, gambling, porn). This means adoption of ESG, whether or not it is ultimately a good idea, will put a slow squeeze on several gigantic economic sectors, where only the most powerful companies will be left standing as their smaller competitors are eliminated.

A bill recently introduced by California Senate Democrats Lorena Gonzalez and Scott Wiener, SB 1173, will require the two largest public employee retirement systems in the state, CalPERS and CalSTRS, to liquidate their investments in fossil fuel companies. SB 1173 is just the beginning. If passed, there’s no reason to expect California’s legislators to deliver additional rules to the pension funds to bring them further into compliance with ESG criteria.

California’s public employees, and the unions that represent them, will experience positive and negative impacts from ESG reporting. In the short run, there will be some positives. A ban on private prisons will be a gift to the California Correctional Peace Officers Association. As California’s state and local governing bodies incorporate ESG disclosures into their bond offerings, the climate change provisions of ESG will – in order to elevate their score – justify even greater spending on mass transit projects which generate more union jobs. Also to get a good score, municipalities will have to intensify their high-density zoning codes, which will further increase housing prices and, in turn, drive up property tax revenue — a boon for public bureaucrats.

Public employees and their unions will also benefit as state and local laws incorporate additional social ESG criteria, defined as “everything from LGBTQ+ equality, racial diversity in both the executive suite and staff overall, and inclusion programs and hiring practices.” The implementation of favored environmental and social practices in government, along with the monitoring and in many cases enforcement of those practices in the private sector, will create tens of thousands of new jobs for public employees in California.

In the long run, however, ESG could have a long-term disastrous impact on everyone’s economic fortunes, certainly including the public sector. Environmental policies aimed at destroying the fossil fuel industry will leave California with expensive and unreliable renewable energy that depends on foreign imports for systems and raw materials. Social policies that enforce proportional representation by race and gender in all organizations, irrespective of skills and aptitude, will render California’s government agencies and private industries less equipped to compete globally, because they will have deliberately recruited less competitive workforces. And public employee pension funds, crippled by restrictions on where funds can and can’t be invested, will see less of a return as huge swaths of the economy are deemed not politically correct enough to invest in.

Ultimately, the consequences of allowing ESG to undermine California’s economy will mean less prosperity, which will result in lower sales and income tax collected to support the public sector. Less prosperity will also result in lower investment earnings by California pension funds that are already dangerously underfunded and rely on high rates of return to remain solvent. When it comes to ESG, California’s public sector employees, and their unions, may want to think very carefully about what they’re getting themselves into.

This article originally appeared in the California Globe.

 *   *   *

California State and Local Liabilities Total $1.6 Trillion

California’s total state and local government debt now stands at almost $1.6 trillion, or about half the state’s GDP.

That isn’t an alarming ratio when compared to the national debt, which has now soared to 128 percent of U.S. GDP with no end in sight. But Californians carry this $1.6 trillion state and local debt ($40,000 per capita) in addition to their share of the national debt (about $90,000 per capita).

Consolidated data on state and local debt is maddeningly difficult to compile. Getting the most recent data for California’s state and local bond debt requires downloading and analyzing the publicly released annual financial reports for 58 counties, 481 cities1,037 school districts, and 3,400 special districts. And even if data miners were to apply sweat and algorithms to this chore, at this moment in early 2022 the complete dataset can be obtained only for the fiscal year through June 30, 2020.

Rather than engage in a from-the-ground-up exercise in data gathering, we have turned to the U.S. Census Bureau’s 2019 “State & Local Government Finance Historical Datasets and Tables,” which is the Bureau’s most recent compilation. According to the Census Bureau, California’s total state long-term debt was $145 billion at the end of 2019, and California’s total local debt was $361 billion. This total, $506 billion, passes the sanity check when compared to the 2017 state/local debt estimate we compiled a few years ago, $482 billion. The slight upward trend comports well with the probability that newly issued bonds each year will marginally exceed the amount by which existing bonds are paid down or retired.

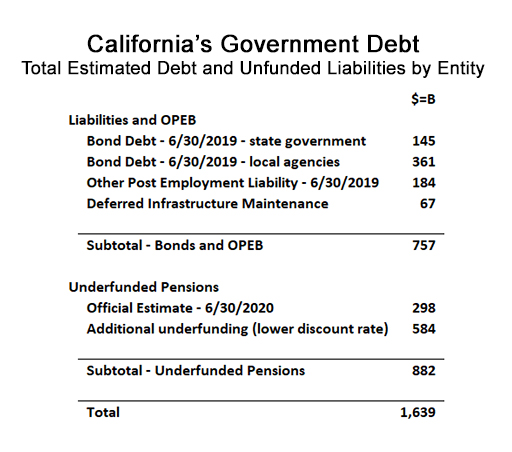
Another significant source of state and local debt is Other Post Employment Benefits, or “OPEB,” which refers to financial obligations that agencies have for current and future retirees, primarily for health insurance. Based on a 2021 study by the Reason Foundation‘s Marc Joffe, we report that California’s state and local agencies have a cumulative OPEB liability of $184 billion.

But OPEB, by virtue of being “other” post employment benefits, does not include the elephant in the room, pensions. California’s State Controller provides comprehensive data on state and local government pension obligations on their “By the Numbers” website. From this downloadable data, updated through June 30, 2020, we are able to calculate the officially recognized unfunded pension liability, which is the amount by which the current value of invested pension fund assets do not equal the present value of pensions to be paid to current and future retirees. The Controller calculates that deficit at $298 billion, but we believe that’s overly optimistic. We believe the official estimate falls $584 billion short of what will actually be required to pay these pensions. The result: we estimate California’s state and local governments owe the pension system $882 billion.

Clearly, such an estimate merits a more lengthy discussion, which will follow. Also to be discussed is California’s deferred infrastructure maintenance, a liability which according to the California Office of Legislative Analyst is now $67 billion. Depicted below is a chart that summarizes our estimate of California’s total state and local government debt:

In 2012, Moody’s Investors Service revised its method of valuing pension liabilities, with the principal adjustment being what discount rate to use when calculating the present value of projected future pension payments to retirees. The lower the discount rate used, the higher the present value. Moody’s now recommends using the high-grade long-term corporate bond index discount rate, which today is pegged at 3.15 percent. By contrast, California’s state and local government pension systems currently calculate the present value of their future pension payments (“Total Liability”) by applying the annual rate-of-return at which they expect their assets to appreciate. For CalPERS, California’s largest pension system, that rate is currently set at 6.8 percent.

The difference between using a rate of 6.8 percent vs 3.15 percent to calculate the present value of future payment obligations is shown on the next chart. It’s not subtle.

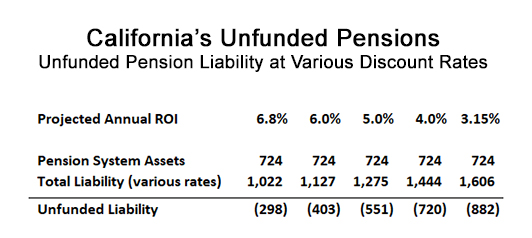
As you can see on row two, “Total Liability (various rates)” increases as the projected annual return-on-investment is reduced. And the bigger the liability, the bigger the shortfall between the Pension System Assets and the amount they need to cover. Hence the unfunded liability grows as the amount a pension system thinks it can earn each year shrinks. The column to the far left reflects the official estimate, $298 billion, for California’s total state and local agency unfunded pension liability. The column on the far right reflects that same liability based on the much lower 3.15 percent rate used by Moody’s Investor Services, $882 billion. The intermediate columns reflect the amount of the unfunded pension liability at rates in between these two extremes, 6.0 percent, 5.0 percent, and 4.0 percent.

Given the size of these numbers, and the dire financial consequences of getting the projections wrong, the controversy over which percentage to use is probably the most consequential public debate that nobody has ever heard of. Stanford economist Joshua Rauh argues that pension liabilities should be discounted by the risk-free rate because they are virtually certain to be paid. In a 2019 study, he used 2.5 percent, based on the historical volatility of equity investments.

We can only really know the right discount rate in hindsight, of course, and in hindsight one might argue that over the past 20 years the results are reassuring. As noted on the “Returns Tracker” maintained by the trade publication Pensions and Investments, the 20-year average return for CalPERS was 6.9 percent, and for the California State Teachers’ Retirement System (CalSTRS) it was 7.6 percent. California’s other smaller government agency pension funds have generally produced similar results.

Do these encouraging returns over the past 20 years justify complacency? That’s tough to say, but before dismissing concerns about their future it’s fair to wonder how the pension systems dug themselves into a hole that is, by the most generous analysis, nevertheless at least $298 billion dollars deep.

You can find a summary of some of the events leading to such a state of affairs in a 2018 California Policy Center report “Did CalPERS use accounting ‘gimmicks’ to enable financially unsustainable pensions.” The Cliffs Notes version: They did. At the turn of the century, on the basis of optimistic projections and creative accounting – and egged on by government union leaders – CalPERS management sold local and state elected officials on a scheme to bump most pension benefits by 50 percent, with retroactive effect. The rest of California’s government pension systems quickly followed suit. With technology stocks driving a fantastic bull market in the 1990s, nobody thought anything could possibly go wrong. But after the October 2008 crash, pension funds found themselves demanding higher and higher payments from government payroll departments, a trend that continues to this day.

While Governor Jerry Brown’s Public Employee Pension Reform Act (“PEPRA”) of 2013 has begun to take some financial pressure off the pension systems, they are in no position to handle another crash. Even today, following a remarkable 10-year technology-driven bull market, the pension systems acknowledge they’re only 71 percent funded. If history repeats itself, the funds – and the California taxpayers responsible for them – are in for a shock.

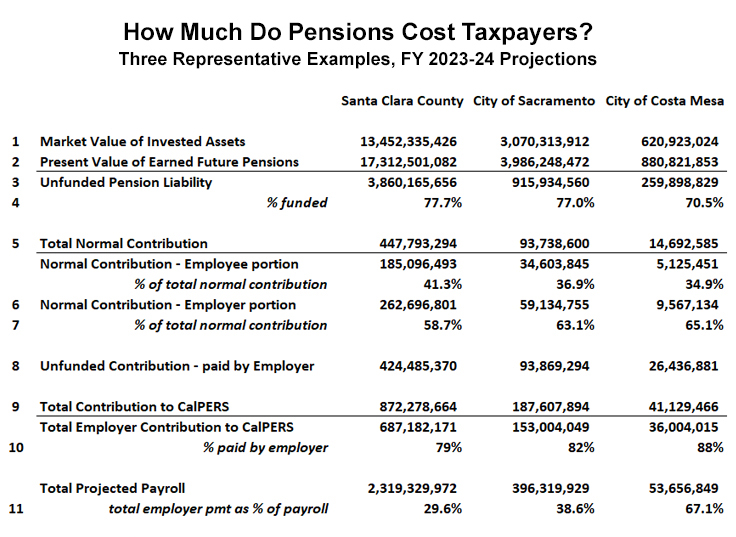
As it is, in 2020, using data provided by the State Controller, California’s state and local governments contributed $46 billion to the pensions systems; through withholding, government employees contributed another $15 billion. This total, $61 billion, exceeds the amount realized through returns on pension system assets in 2020, which was only $42 billion. From a related angle, California’s public retirement systems paid out $65 billion in pension benefits in 2020, while collecting $60 billion in contributions. It was never the intention of the pension systems to be requiring agencies to pay in as much each year as the systems were paying out in benefits.

To illustrate how this misleading claim – that investment returns would be the primary source of pension system funding – was used to justify increasing pension benefits, and is currently used to prevent further reform, consider this “Myths and Facts” webpage, paid for by California’s government unions. In a document replete with selective use of facts and data, this stands out: “According to the latest data, CalSTRS employers, including the state, contribute 25 cents of every pension dollar paid.” This is clearly false. According to the State Controller, as we have seen, when $65 billion in pension benefits was paid out in 2020, $42 billion was paid into the pension systems by government employers. That’s 65 percent, not 25 percent.

How Will Inflation Affect California’s Pensions?

At first glance, the fact that pension systems put a cap on their annual cost of living adjustment (“COLA”) – this varies but typically does not exceed three percent – might suggest that another paroxysm of multi-year inflation would be at least restore pension solvency. One could reasonably assume that if growth of the liability is capped at around three percent per year, while annual contributions to the pension systems rise because they’re being withheld from payrolls that driven higher by cost-of-living adjustments pegged to inflation well in excess of three percent, then the unfunded liability will wither away. But that reasoning is flawed. The way pensions are structured in California, if there is a sustained bout of high inflation, the cap is uncapped.

For better or for worse, all pension systems guarantee retirees a purchasing power “protection allowance” of 75 to 80 percent, meaning that inflation cannot erode the value of a pension payment below that threshold. This means the cost-of-living adjustments, once pension payments hit that floor, will have no ceiling. The question then becomes whether real rates of return (nominal rate of return less the rate of inflation) will be sufficient to fund pension systems that have hedged their beneficiaries against inflation during a period of high single digit or even double-digit inflation. Nobody knows how that is going to turn out, but if real returns falter, agency contributions will have to pick up the slack. It could be a lot of slack.

What this really comes down to is the so-called real rate of return that a pension system can earn. This refers to the nominal performance of the fund, which in CalPERS’ case has averaged 6.9 percent over the past 20 years through 2020, minus the rate of inflation. CalPERS actuaries, when projecting the system’s future pension liability, currently use an inflation assumption of 2.5 percent per year. This means they currently assume their real rate of return to be 4.4 percent.

This is the context in which to view pension fund performance in excess of, in the case of CalPERS, for example, 6.9 percent. That target is misleading and insufficient when inflation is greater than 2.5 percent per year. As the purchasing-power protection allowance kicks in for retiree after retiree in system after system, just to stay even, a pension system such as CalPERS needs its annual return on invested assets to achieve returns that are 4.4 percent above the rate of inflation. If inflation is seven percent, as just reported by the U.S. Dept. of Labor for the 12-month period through January 2022, then just to stay even, CalPERS would need to turn in an investment performance of 11.4 percent.

Pension systems in California have not experienced significant inflation over the past 20 years, which is the period during which they have been coping with the impact of the benefit enhancements awarded around the turn of the century. During the inflationary era 1973 to 1981stock indexes were negative in nominal terms. This exemplifies the volatility of investment returns and lends credence to conservative analysts such as Stanford economist Joshua Rauh urging actuaries to use even lower discount rates than Moody’s has applied.

Volatility Defines California’s Public Finances

In addition to investment performance and background inflation, the financial health of pension funds is highly sensitive to life expectancy and the ability of agencies to pay the required annual contributions. That’s just a very big and very representative subset of the financial challenges facing all public agencies in California.

There are other challenges. California’s state tax revenues are inordinately dependent on high-wage earners, as documented herehere, and here. In turn, those high-wage earners are reaping windfalls during tech booms. But booms are by definition cyclical, and when the tech boom busts, not only do state income tax revenues plummet, but the tech-driven investment returns of the pension funds falter at the same time. The financial status of California’s pension funds may not be truly alarming today – 71 percent funded is not “alarming,” but it’s far from “excellent” – and the vaunted surpluses in the state budget, swollen with slices of tech-baron bounty and billions fresh off federal printing presses, may suggest a rosy future. But when the economic pendulum swings back the other way, state and local government agencies will face unprecedented budget deficits – at precisely the same time the pension systems are demanding increased contributions from state and local governments.

SOLUTIONS

To restore stability to the system, pension reform must be part of a broader package of policy shifts. For government workers to be able to financially tolerate lower pension benefits, the cost of living in California has to become competitive with other states. This will require business deregulation, which is contrary to everything California’s legislature has worked toward over the past few decades.

The state could also lower California’s cost-of-living by investing in so-called “good debt,” that is, projects that yield long-term economic benefits. Water infrastructure is a prime example. If the state upgraded California’s water system to 21st century standards to create a surplus of water at an affordable price to consumers, it would make it possible to build new homes – homes that cannot get permits without a reliable water supply. It would enable California’s agricultural industry to produce vegetables and dairy products at lower prices. It would make it possible for businesses that use water to offer their products and services at affordable rates and still make a profit. And it would make water utility bills affordable to low-income households.

The California Office of Legislative Analyst estimates just to complete the deferred maintenance of public infrastructure in the state would cost $67 billion. This of course merely scratches the surface of what is needed, since the LAO’s narrow definition of deferred maintenance refers to the backlog of maintenance work required on existing infrastructure, not the infrastructure we need today, and should have been building for the past few decades. To create the economic prosperity and lower cost of living that would permit more cost-effective government and right-sized pension benefits, investment in new public infrastructure is required. And to state the obvious, High Speed Rail does not qualify. High Speed Rail epitomizes bad public infrastructure investment and bad debt, because it will constitute a permanent economic drain.

A discussion of what public infrastructure exists in California, vs. what public infrastructure ought to exist by now, is beyond the scope of this analysis of the total state and local debt that confront California’s taxpayers. But just like pensions, when insufficient investment is made on an ongoing basis, the financial obligation builds up and its burden falls on future generations. And unlike pensions, which can be right sized, or restored to solvency every time there is a capricious bump in the value of the invested assets of the pension systems, the only cure for neglected infrastructure is to either commit to massive new spending, or submit citizens to rationing and high prices for every basic necessity – transportation, housing, energy, and water. For the time being, California’s policymakers are firmly committed to the latter.

For this reason, one might argue California’s true debt overhang is not the officially recognized $1.0 trillion, or even the $1.6 trillion (or more) that accrues if pension analysts use more prudent financial assumptions when calculating the unfunded liability. Taking into account the cost for the public infrastructure that Californians deserve, and that should have been built by now, it is reasonable to assume California’s state and local public debt exceeds $2.0 trillion.

Whether it’s one trillion or two trillion, California’s total state and local government debt, given the size of its economy, may still not be unmanageable at the moment. But the choices California’s legislators and pension boards make over the next few years will determine whether a truly devastating financial and economic crisis materializes or, instead, government agency balance sheets acquire the resilience necessary to cope with the economic turbulence that could lie just ahead.

An edited version of this article appeared on the website of the California Policy Center.

 *   *   *