California’s Climate Agenda Sets an Impossible Example for the World

We will never waver on achieving the nation’s most ambitious clean energy goals..
–  Excerpt from Gavin Newsom’s State of the State Address, January 12, 2019

California has long been proclaiming itself the leader in fighting “climate change,” and incoming governor Gavin Newsom promises to continue the efforts. The big push began over ten years ago, with Gov. Schwarzenegger, who pivoted left after failing to reform public employee unions in 2005. Schwarzenegger promoted, then signed, AB 32, in 2006. This so-called “Global Warming Solutions Act,” set the initial targets for greenhouse gas reduction, empowering the California Air Resources Board to monitor and enforce compliance with laws and regulations aimed at achieving these reductions.

Other significant legislation followed. SB 107, also passed in 2006, mandated a “renewable portfolio standard,” wherein by 2010 at least 20% of California’s electricity would come from renewable sources.

The legislation has been unrelenting. SB 1, 2006, mandated utilities pay rebates to homeowners that installed photovoltaic panels on their roofs. AB 118, 2007, funded the “Alternative and Renewable Fuel and Vehicle Technology Program,” the first step towards mandating a minimum percentage of electric and hybrid vehicle sales. SB 375, 2008, the “Sustainable Communities and Climate Protection Act,” directed cities and counties to increase the housing density of their communities.

When Jerry Brown took over as Governor in 2010, legislation accelerated. SBX1-2, 2011, raised the renewable portfolio standard to 33% by 2020. AB 1092, 2013, mandated electric vehicle charging stations in new multi-family dwellings. SB 1275, 2014, set a goal of 1.0 million “zero emission vehicles” by 2020. SB 350, 2015, raised the renewable portfolio standard to 50% by 2030. SB 32, 2016, set a greenhouse gas emission reduction target of 40 percent below 1990 levels by 2030. AB 398 extended the “cap and trade” program to 2030.

This is just a partial list. High speed rail, water rationing, “urban containment” policies, a virtual prohibition on any conventional energy development, retrofit mandates for trucks and dwellings, and much more – all of it has come down from Sacramento in an attempt to “address climate change.”

But will any of this work? Is California setting an example that the world can follow?

CAN RENEWABLES MEET FUTURE GLOBAL ENERGY DEMAND?

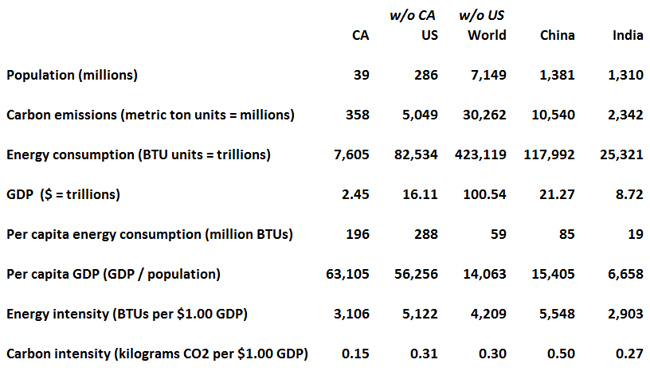
The short answer is no. Renewables alone cannot possibly power the global economy. Using data on energy from the BP Statistical Review of World Energy, along with population data from the World Bank, the following graphics make this clear.

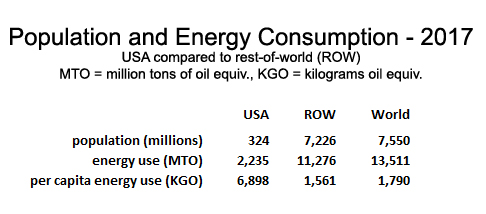
In the above chart, row one shows the US population in 2017 of 324 million, which is 4.3 percent of the world total. Over 7.2 billion people are living in the rest of the world “ROW.” Row two shows that in 2017, using million metric tons of oil equivalents, the US consumed 2.2 billion “MTO equivalents,” which was about 17 percent of all energy consumed worldwide. That is, in 2017 the average American consumed nearly 4.5 times as much energy as the average person living in the rest of the world. Expressed as kilograms of oil in row three of the chart, in 2017 the average American burned 6,898 “KGO equivalents,” while the average for someone living in the rest of the world was only 1,561.

Most people would agree that access to cheap energy is a prerequisite for economic development, which in turn sets in motion a cascade of positive effects on societies – individual empowerment, female emancipation, access to clean water, healthcare, education, reduced infant mortality, fewer infectious diseases.

If one accepts that argument, the next chart projects how much more energy needs to be produced worldwide to achieve these positive economic benefits, and the positive effects that would follow from more abundant and affordable energy worldwide. A primary assumption is that Americans become somewhat more efficient in their use of energy, with their per capita KGO/year consumption declining from the 2017 average of 6,898 to 5,000 by 2035. The other related assumption is that the people living in the rest of the world increase their energy consumption from the 2017 average of 1,561/year up to 2,500/year by 2035, which would still only be one-half as much per capita as Americans would be consuming.

Based on these assumptions regarding individual energy consumption trends, as can be seen on the above chart, total global energy production will need to increase by 71 percent, from 13.5 billion metric tons of oil equivalents in 2017, to 23.1 per year in 2035. This is based on World Bank projections for 2035 that estimate the US population at 355 million and estimate the total world population increasing to 8.9 billion.

Can windmills and solar panels make that happen? They’ll have a long way to go. The next chart, courtesy of BP’s most recent Statistical Energy Review, shows the fuel mix of global energy production today.

It’s hard to even find the renewable slice on this graphic that shows global energy production by type for the last 25 years. On the right, where the 2017 mix is depicted, renewables are the minute orange slice, just below coal (grey), and hydroelectric (blue). As is obvious, coal, natural gas (red), and oil (green), constitute the overwhelming majority of energy produced in the world.

It is difficult to imagine 50% of this chart to be represented by renewables by 2035, when even under minimal scenarios to provide adequate energy for economic development, global energy production needs to nearly double. But how green are renewables?

IS RENEWABLE ENERGY REALLY CLEAN AND GREEN?

To answer this, an unlikely source provides an illuminating perspective. From the website of the “Deep Green Resistance,” a critique of green and renewable power is offered with a lucidity that eludes California’s policymakers. If the “deniers” of the right have no credibility with California’s green movement, perhaps the deep greens do. Consider these excerpts from the Deep Green Resistance website’s “Green Technology & Renewable Energy” FAQs:

“Aren’t renewables better than fossil fuel?

It’s debatable whether some ‘renewables’ even produce net energy. The amount of energy used in the mining, manufacturing, research and development, transport, installation, maintenance, grid connection, and disposal of wind turbines and solar panels may be more than they ever produce.

What about solar power?

Solar panel production is now among the leading sources of hexafluoroethane, nitrogen triflouride, and sulfur hexaflouride, three extremely potent greenhouse gases which are used for cleaning plasma production equipment. As a greenhouse gas, hexaflouroethane is 12,000 times more potent than CO2, is 100% manufactured by humans, and survives 10,000 years once released into the atmosphere. Nitrogen Triflouride is 17,000 times more virulent than CO2, and Sulfur Hexaflouride is 25,000 times more powerful than CO2. Concentrations of nitrogen triflouride in the atmosphere are rising 11% per year.

What about wind power?

One of the most common wind turbines in the world is a 1.5 megawatt design produced by General Electric. The nacelle weighs 56 tons, the tower 71 tons, and the blades 36 tons. A single such turbine requires over 100 tons of steel. This model is a smaller design by modern standards. The latest industrial turbines stand over 600 feet tall and require about eight times as much steel, copper, and aluminum.

What about hybrid and electric vehicles?

The production of electric cars requires energy from fossil fuels for most aspects of their production and distribution. This requirement is perhaps even more extreme with electric cars as there is a need to manufacture them to be as lightweight as possible, due to the weight of the battery packs. Many lightweight materials utilized are extremely energy intensive to produce, such as aluminum and carbon composites. Electric/hybrid cars are also charged by energy that, for the most part, comes from power plants using natural gas, coal or nuclear fuels. A recent study by the National Academies, which analyzed the effects of vehicle construction, fuel extraction, refining, emissions, and other factors, has shown that the lifetime health and environmental impacts of electric vehicles are actually greater than those of gasoline-powered cars.”

These are tough assertions. Not included here is the environmental footprint for literally gigawatt-years of storage capacity, not only to deliver continuous energy on windless nights, but, even more daunting, in winter when there are far fewer hours of sunlight. Most of what the Deep Green Resistance advocates may be considered dangerous extremism, but their assessment of renewable energy cannot be ignored.

Where California’s mainstream greens depart from the deep greens is in their optimism. But a realistic assessment of renewable energy must combine the optimism of mainstream greens with the lucidity of the deep greens.

Renewables are not necessarily “greener” than conventional energy, particularly if conventional energy is produced using the cleanest technologies available. If the all the governments on earth enforced on their peoples the experiment that California is committed to – 50% renewable energy by 2030 – the likely result would be the collapse of civilization that the deep greens not only predict, but wish to hasten.

An “all-of-the-above” energy strategy is the only way to offer humanity the possibility of peaceful economic development.

Back in the 1990s, when environmentalism had not yet matured into the polarizing climate change bogeyman that it has become, one of the most reputable environmentalist journals was produced by the WorldWatch Institute. Back then, they consistently advocated “methane” (natural gas) as the “transitional fuel” to power the global economy until breakthrough technologies such as fusion power or satellite solar power stations became commercially viable. More recently, environmental activists such as Greenpeace co-founder Patrick Moore have advocated nuclear power as an essential part of our global energy future.

There is no place on earth more capable of developing clean fossil fuel and nuclear power than California. Californians have a choice. They can impoverish their population by creating artificial scarcity of land, energy and water, enforcing draconian restrictions on all development in the name of fighting climate change. Or they can face reality, and become pioneering partners in a new age of clean energy development from all sources. That would set a viable example for the world to follow.

This article originally appeared in the California Globe.

 *   *   *

The Immutable Algebra of Global Energy and Population Trends

Compassion for a child in distress is automatic. You do everything you can for that child. You use all the resources you can muster. But what if an entire continent is in distress? What if billions of children are in distress?

This is the question for which there are no easy answers. Because across the developing world, billions of people still endure political violence and extreme poverty. The most afflicted nations are almost always the nations experiencing rapid population increase. And the solutions being proposed, mass immigration and rapid transition to renewable clean energy, require authoritarian, global governance that will rob the people of the developed world of their freedom and prosperity, at the same time as it does little or nothing to help the people living in the developing world. But it is the path of least resistance.

The reason for pursuing flawed solutions has more to do with where the global elites mean to apply authoritarian pressure than with whether or not more lives will be improved, or the planet’s climate will be preserved.

Before exploring alternative solutions, the scope of the challenge should be quantified. The best way to do this is by reviewing trends in global population and energy consumption. The figures to be presented draw on two sources, the World Bank Population Estimates and Projections, and the BP Statistical Review of World Energy.

GLOBAL POPULATION TRENDS

The two pie charts below depict projected global population by region in 2020, and 30 years hence, in 2050. They are sliced by region, with the categories as defined by British Petroleum in their annual energy review. The “Russosphere” refers to the nations of the former Soviet Union that have not joined NATO. The other categories are fairly self explanatory.

As can be seen, more than half of the world’s 7.7 billion people—4.2 billion—live in the Asia/Pacific region, including the demographic heavyweights of China, India, Pakistan, Bangladesh, and Indonesia. As can be seen, five of the other six regions have between 0.3 and 0.5 billion people each. The exception is Africa, with a projected 2020 population of 1.3 billion.

What happens between 2020 and 2050 is extremely significant. First, note the diameter of the second pie chart. The increase in area is exactly proportional to the projected increase in global population between 2020 and 2050. As can be seen, in terms of people inhabiting planet earth, the footprint doesn’t get all that much larger. The world’s population will grow by 25 percent. But where will this growth occur?

The projected population in the Asia/Pacific region will grow by a half-billion, and the population of the six other regions excluding Africa will increase from a total of 2.2 billion in 2020 to 2.5 billion in 2050. Africa, by contrast, will roughly double in population, from 1.3 billion to 2.5 billion. That is, over the three decades between 2020 and 2050, Africa will add 1.2 billion people to its population, whereas the rest of the world combined will add another 0.8 billion.

If projected population growth were spread evenly among nations over the next 30 years, that would pose a different set of challenges. But the problem we face is that between now and 2050, two-thirds of the world’s population growth will occur on the most undeveloped, poverty-stricken continent on earth.

GLOBAL ENERGY TRENDS

To understand just how inadequate current globalist policies are with respect to immigration and energy, especially when facing an exploding population among the most undeveloped nations on earth, global energy trends offer clarity. The next chart shows per capita energy use by region last year. To make the data as intelligible as possible, all energy use—from wood burning to nuclear power—is normalized and expressed in terms of gallons of oil. The differences between regions are profound.

As shown, the average North American—that includes citizens of Canada and Mexico, along with the United States—consumed energy last year equivalent to 1,662 gallons of oil. That’s nearly twice that of the other relatively heavy energy consumers in Europe, the Russosphere, and the Middle East, and it’s nearly four times more than in Central or South America, or in the Asia-Pacific. But take a look at Africa.

The per capita energy consumption by Africans in 2017 was equivalent to 101 gallons of oil. Less than one-sixteenth the amount of energy North Americans consume.

The next chart shows projected global energy use by region in 2020. It is derived from the data shown on the previous pie chart depicting global population by region in 2020, multiplied by per capita energy use by region. The units expressed are “billion tons of oil equivalents,” that is, they depict how much all worldwide energy use would be, if the energy used were exclusively oil.

By the way, for the uninitiated, this is a common practice among energy economists in order to show the relative proportions of energy production and consumption in normalized units. A gallon of gas contains within it 120,429 British Thermal Units, or BTUs, of energy; one kilowatt-hour contains 3,412 BTUs. You can convert all types of energy to, to name a few common examples, BTUs, or joules, or metric tons of oil. Take your pick.

It is obvious from looking at this chart that North America and Europe use far more energy than the global average. Equally obvious is just how small Africa’s slice of global energy consumption is currently, only 3.3 percent of the total despite representing 17.4 percent of global population.

So how will this same chart look in 2050?

GLOBAL ENERGY PRODUCTION NEEDS TO DOUBLE

Below is a pie chart showing one scenario for global energy consumption by region in 2050. First consider the area of the chart, which is exactly twice that of the pie chart for 2020. For the purposes of this analysis, imagine that total energy consumption worldwide will double by 2050. Further suppose that the per capita consumption of energy worldwide will be allocated equally to every human on earth. The implications of these assumptions provide useful insights.

For starters, if energy were consumed equally everywhere, and the total amount consumed were doubled, that would require North Americans to reduce their per capita energy use by 50 percent. In reality, Americans, who consume more energy per capita than Canadians or Mexicans, would have to reduce their per capita energy use by morethan 50 percent.

This bears repeating: If global energy consumption doubled, the per capita energy available worldwide would be less than half of what Americans currently consume.

This isn’t a value judgement. It’s just basic algebra.

Next, note the African slice of this energy consumption pie for 2050. At the energy equivalent of 6.9 billion tons of oil, for the Africans in 2050 to enjoy less than half as much energy as Americans currently enjoy, they would consume a quantity of energy equal to half of all energy consumed worldwide today. And to accomplish this by 2050, energy consumption in Africa would have to increase by a factor of 36. These are mind-boggling statistics. Yet they perfectly illustrate the magnitude of the development challenge facing Africa, insofar as access to affordable energy is one of the prerequisites to reducing poverty.

RENEWABLES VS ALL OF THE ABOVE

It is into the granite face of these immutable demographic and economic facts that the agenda of the renewables lobby collides. Global population and energy trends indicate that the production of energy will need roughly to double in the next 30 years in order to better assure a peaceful evolution of the most economically and politically fragile regions in the world.

The next pie chart, resized down to the 2020 projected total global energy consumption equivalent to 14.4 billion tons of oil, depicts renewables as producing a 0.8 billion-ton-oil equivalent of the total, or 5.6 percent. This 2020 projection, by the way, relies on continued rapid growth of renewables over the next few years, based on the increase of 16.6 percent between 2016 and 2017. In 2017, renewables only provided 3.6 percent of total global energy. These 2020 projections are a best case scenario.

Now imagine this pie chart again doubled in size. Imagine renewables providing 100 percent of this total—the equivalent of 26.7 billion tons of oil. Does that sound ridiculous? Maybe it does, but going “100 percent carbon free” by 2045 is the goal of recent legislation in California. To do this worldwide between 2020 and 2050 would require renewables to increase by a factor of 34 (from 2017 levels, 55).

Imagine wherever you see one windmill, there are 50. Imagine wherever you see a stretch of open space covered with photovoltaics, you see 50 times that much area so covered. Imagine the footprint of these devices, their cradle-to-grave environmental impact. Their contribution to the heat-island effect. Their contribution to avian slaughter, their consumption of land and air. Imagine the ecological impact of producing, maintaining, and reprocessing batteries capable of storing tens of thousands of gigawatts, all over the world. Imagine the cost.

Fact is, we are not going to run out of fossil fuels. At current rates of consumption, proven reserves of oil will last another 179 years; natural gas, 54 years; coal, 505 years. Over the past several years, these reserve ratios, reported on the basis of proven, economically recoverable reserves of fossil fuel resources, have been increasing, not decreasing. “Proven” reserves of conventional fossil fuel will continue to increase into the foreseeable future, without even accounting for vast deposits of so-called unconventional reserves such as methane hydrates. Doubling energy production worldwide within 30 years is a daunting challenge. It is impossible quickly to achieve that goal without fossil fuel, and concern about running out is unfounded.

NO SOLUTIONS ARE EASY

It goes beyond the scope of this analysis thoroughly to assess the cost and environmental impact of installing wind and solar systems, along with grid upgrades and mega-storage. Suffice here to say their environmental impact, their scalability, their sustainability, their practicality, and their cost are all problematic.

Similarly, it goes beyond the scope of this analysis properly to debunk the climate hysteria that is used as cover for this astonishingly flawed approach to delivering adequate energy worldwide. But given the incendiary nature of any flirtation with climate change “denial,” here are links to a few noteworthy climate contrarians: Jo NovaJudith CurryRoger Pielke Jr.Marc Morano, the Heritage Foundation’s Environment website, JunkScience.com, the Science and Environmental Policy ProjectWatts Up With That, and Bjorn Lomborg. Please note: these websites range from blatantly insouciant to eminently measured, but all of them offer valuable information.

It is necessary, however, to connect climate alarmism not only to flawed energy policies, but also to futile immigration policies.

The argument goes something like this: Because imperialist Western nations rapaciously exploited resources in the developing world, they impoverished these nations. At the same time, the Western nations burned fossil fuel, which created droughts and extreme weather in the developing nations, which further worsened their plight. For these reasons, Western nations must admit refugees from developing nations, because if the West had left these countries alone and if the West had not ruined their climates, these nations would be thriving. At the same time, and for the same reasons, Western nations must pay reparations to developing nations, in order for them to recover from the damage caused by the West.

There are two mind-numbingly obvious flaws to this argument, even if you agree with its premises. First, the West cannot possibly absorb hundreds of millions of immigrants. Second, “reparations” in the form of foreign aid, at least to-date, are the real reason the populations in these nations continues to explode. But to propose alternatives, an uncomfortable fact has to be confronted. Africa is a welfare continent, and welfare for Africa has failed.

AFRICA – THE WELFARE CONTINENT

Most evidence gathered over the past 60 years suggests that Africa is a welfare continent in some of the worst connotations of that term. For example, the average number of children in Somalia in 1960 was 7.3, but by the year 2000 that average had actually climbed to 7.6, suggesting that Western food aid and Western medicine lowered the death rate, and lowered infant mortality, but accomplished little in terms of female emancipation, or nurturing indigenous prosperity that correlates with lower birthrates. Somalia is typical.

Burgeoning Nigeria, a nation projected to have 410 million citizens by 2050, saw average fertility decline only slightly, from 6.4 in 1960 to 6.1 in 2000. Fertility in Ethiopia, destined to have nearly 200 million inhabitants by 2050, went from 6.9 in 1960 to 6.5 in 2000. Average fertility in tiny Uganda, where more than 105 million people are expected to reside by 2050, went from 7.0 in 1960 to 6.9 in 2000. Estimates for 2020 are just that: estimates. There is no hard evidence that the population rate of increase in sub-Saharan Africa will slow sufficiently for Africa’s projected population in 2050 to “only” reach 2.5 billion.

The ironic reality is that Africa quite likely would have been better off if no foreign aid, at least as it was formulated, had reached its shores after 1960. Not only did foreign aid play a vital role in enabling Africa’s population to have already more than quintupled since then and now, but to the extent that foreign aid was feeding people in nations that should have been developing their own rich agricultural potential, or providing medical treatment to people in nations that as a consequence had less incentive to train their own doctors, the aid instead went into the pockets of corrupt dictators who had no interest to invest in a brighter future for their nations.

RETHINKING FOREIGN AID, FOREIGN INVESTMENT, AND ENERGY POLICIES

The hard choice comes down to how the powerful Western nations want to apply their wealth and influence to help humanity and heal the planet.

The path we’re on requires shoveling billions in food aid and medical aid to developing nations, with the utterly unsustainable result being exploding populations in societies that don’t evolve and advance internally, because they don’t have to.

The path we’re on requires a parallel campaign to import as many refugees as possible from these developing nations, with the only result being increasing economic burdens on the host nations, and increasing political and cultural conflict in the host nations, with negligible quantitative impact on the destitute and expanding populations of the source nations.

The path we’re on demands a preposterous renunciation of fossil fuel, despite fossil fuel currently providing 85 percent of all global energy, despite the fact that fossil fuel will remain cheap and abundant for at least another generation, if not much longer, and despite the fact that global energy production needs to double in the next 30 years, and nobody has any idea how else that can be accomplished.

Globalism, which underlies these supranational strategies, especially in the context of climate change and immigration, has become a particularly malevolent version of imperialism turned inward. It is an authoritarian response to challenges that are indeed existential—exploding populations of destitute nations, an insatiable global appetite for more energy, and environmental degradation. But it is precisely the wrong response. What happened?

The reason globalism has turned against the populations of developed nations is because that is the path of least resistance. To intervene in Africa, or Honduras, for that matter, with solutions that would work, would revive accusations of imperialism, while simultaneously enraging environmentalists. It is easier for Western elites to blame their own societies for the misery in the developing world. It is easier to import people from the developing world, saturating them with anti-West, redistributionist propaganda, and to bring enough of them in to change the political equation in those nations forever. This strategy is the easiest path towards granting the Western elites carte blanche to continue down the path we’re on. But it’s the wrong path.

The effect of these policies, already well underway, is to exploit the populations of the developed nations, artificially inflating the prices they pay for everything; energy, water, transportation, housing, land, in the name of social equity and saving the planet. The benefit to the elites who own the artificially constrained productive assets is more profit—as costs remain flat and competitive supplies are restricted, profits go up. That is happening today.

The entire scheme is dangerously untenable. Eventually people in the developed nations will rebel—both against the engineered scarcity and against each other in a needlessly fractured culture. And eventually people in developing nations will starve by the millions, if not billions, as Western food and medical aid cannot keep pace with rampant population growth.

Those worried about the climate consequences of the alternative strategy—competitive abundance—should ask themselves what’s worse: a climate that may warm incrementally, possibly due in part to burning of fossil fuel, or another 2 billion people, desperate and destitute, stripping the rainforests for fuel, and wiping out the last great remnants of wild game for the protein.

Western elites must support responsible but competitive and accelerated development of all natural resources, instead of pretending that scarcity will further the goals of social equity and environmentalism. The prosperity that ensues will lead to lower birthrates and urbanization, taking pressure off wildernesses. The increased wealth will fund environmental mitigation.

Western elites must accept the inaccurate but virulent moral opprobrium that will accompany actually investing in places like Africa, as opposed to merely sending food and medical aid. They must embrace compassionate nationalism. They must accept alternatives to the de facto nihilism of mass immigration.

Throughout the developing world, and especially in Africa, Western elites must invest in clean fossil fuel, electricity grids, nuclear power, hydroelectric power, inter-basin water transfers, heavy industry, aquaculture, mega-cities, and universities. To protect their investments, they may have to negotiate charter cities or charter regions with the host nations, where Western laws will be enforceable by Western nations. Achieving stability in these areas won’t be easy. It will invite accusations of imperialism. It may also enable a bright future for not millions, but billions of children.

And maybe it won’t work. But it’s better than the path we’re on.

 *   *   *

Why California’s Global Warming Solutions Act is Misguided Policy

California policymakers are expanding their war on “climate change” at the same time as the rest of the nation appears poised to reevaluate these priorities. In particular, California’s legislature has reaffirmed the commitment originally set forth in the 2006 “Global Warming Solutions Act” (AB 32) to reduce the state’s CO2 emissions to 40% below 1990 levels by 2030.

Just exactly how California policymakers intend to do this merits intense discussion and debate. As the Los Angeles Times reporter put it, “The ambitious new goals will require complex regulations on an unprecedented scale, but were approved in Sacramento without a study of possible economic repercussions.”

The following chart depicts data that helps explain the futility of what California’s citizens are about to endure:

CALIFORNIA ENERGY CONSUMPTION, POPULATION,
GDP, AND CO2 EMISSIONS

Comparisons to the rest of the USA, China, India, and the world


(
For links to all sources for this compilation, scroll down to “FOOTNOTES”)

The first row of data in the above table is “Carbon emissions,” column one shows California’s total annual CO2 emissions including “CO2 equivalents” – bovine flatulence, for example, is included in this number – expressed in millions of metric tons (MMT). As shown, in 2014 (the most recent year with complete data available) California’s CO2 emissions were down to 358 MMT. That’s 73 MMT lower than 1990, when they were 431 MMT. While this is a significant reduction, it is not nearly enough according to California’s state legislature. To hit the 40% reduction from 1990 levels by 2030, CO2 emissions still need to be reduced by another 100 MMT, to 258 MMT. That’s another 28% lower than they’ve already fallen. But California is already way ahead of the rest of the world.

As shown on row 8 of the above table, California’s “carbon intensity” – the amount of CO2 emissions generated per dollar of gross domestic product – is already twice as efficient as the rest of the U.S., twice as efficient as the rest of the world, more than three times as efficient as China, and nearly twice as efficient as India. We’re going to do even more? How?

A few more data observations are necessary. As shown, California’s population is 0.5% of world population. California’s GDP is 2.0% of the world GDP. California’s total energy consumption is 1.4% of world energy consumption, and California’s CO2 emissions are 1.0% of the world’s total CO2 emissions.

These stark facts prove that nothing Californians do will matter. If Californians eliminated 100% of their CO2 emissions, it would not matter. On row 1 above, observe the population of China – 1.4 billion; the population of India – 1.3 billion. Together, just these two developing nations have seventy times as many people as California. The per capita income of a Californian is four times that of someone living in China; nine times that of someone living in India. These nations are going to develop as much energy as they can, as fast as they can, at the lowest possible cost. They have no choice. The same is true for all emerging nations.

So what is really going on here?

If California truly wanted to set an example for the rest of the world, they would be developing clean, safe, exportable technologies for nuclear power and clean fossil fuel. Maybe some of California’s legislators should take a trip to Beijing, where burning coal generated electricity and poorly formulated gasoline creates killer fogs that rival those of London in the 1900’s. Maybe they should go to New Delhi, where diesel generators supplement unreliable central power sources and raise particulate matter to 800 PPM or worse. Maybe they should go to Kuala Lampur, to choke on air filled with smoke from forests being incinerated to grow palm oil diesel (a “carbon neutral” fuel).

According to the BP Statistical Review of Global Energy, in 2015, renewables provided 2.4% of total energy. Hydroelectric power provided 6.8%, and nuclear power provided 4.4%. Everything else, 86% of all energy, came from fossil fuel. In the real world, people living in cities in emerging nations need clean fossil fuel. So they can breathe. Clean fossil fuel technology is very good and getting better all the time. That is where investment is required. Right now.

Instead, purportedly to help the world, California’s policymakers exhort their citizens to accept a future of rationing enforced through punitive rates for energy and water consumption that exceed approved limits. They exhort their citizens to submit to remotely monitored, algorithmic management of their household appliances to “help” them save money on their utility bills. Because supposedly this too averts “climate change,” they restrict land development and exhort their citizens to accept home prices that now routinely exceed $1,000 per square foot anywhere within 50 miles of the Pacific coast, on lots too small to even put a swing set in the yard for the kids. They expect their citizens to avoid watering their lawns, or even grow lawns. And they will enforce all indoor restrictions with internet enabled appliances, all outdoor restrictions with surveillance drones.

This crackdown is a tremendous opportunity for a handful of high-technology billionaires operating in the Silicon Valley, along with an accompanying handful of California’s elites who benefit financially from politically contrived, artificial resource scarcity. For the rest of us, and for the rest of the world, at best, it’s a misanthropic con job.

The alternative is tantalizing. Develop clean fossil fuel and safe nuclear power, desalination plants, sewage recycling and reservoirs to capture storm runoff. Loosen restrictions on land development and invest in road and freeway upgrades. Show the world how to cost-effectively create clean abundance, and export that culture and the associated enabling technologies to the world. Then take credit as emerging nations achieve undreamed of prosperity. With prosperity comes literacy and voluntarily reduced birthrates. With fewer people comes far less pressure on the great wildernesses and wildlife populations that remain, as well as fisheries and farmland. And eventually, perhaps in 25 years or so, renewables we can only imagine today, such as nuclear fusion, shall come to practical fruition.

That is the example California should be showing to the world. That is the dream they should be selling.

 *   *   *

This article originally appeared on the website of the California Policy Center.

FOOTNOTES

Population
World Population Clock:
http://www.worldometers.info/
https://en.wikipedia.org/wiki/List_of_countries_and_dependencies_by_population
Directorate-General of the European Commission:
https://en.wikipedia.org/wiki/Eurostat
https://en.wikipedia.org/wiki/List_of_European_Union_member_states_by_population
US Census Bureau – California:
http://www.census.gov/quickfacts/table/PST045215/06

Carbon Emissions
U.S. Energy Information Administration:
http://www.eia.gov/state/rankings/?sid=CA#series/226
United Nations Framework Convention on Climate Change:
http://unfccc.int/ghg_data/ghg_data_unfccc/items/4146.php
http://edgar.jrc.ec.europa.eu/overview.php?v=CO2ts1990-2014&sort=des9
https://en.wikipedia.org/wiki/List_of_countries_by_carbon_dioxide_emissions

Total Energy Consumption
BP Statistical Review of World Energy:
http://www.bp.com/content/dam/bp/en/corporate/pdf/bp-statistical-review-of-world-energy-2015-full-report.pdf
California per capita energy consumption:
http://www.eia.gov/state/rankings/?sid=CA#series/12

GDP
World Bank:
http://databank.worldbank.org/data/download/GDP_PPP.pdf
https://en.wikipedia.org/wiki/List_of_countries_by_GDP_(PPP)
US Dept of Commerce – Bureau of Economic Analysis:
https://www.bea.gov/newsreleases/regional/gdp_state/gsp_newsrelease.htm
https://en.wikipedia.org/wiki/List_of_U.S._states_by_GDP

Note: There are only minor differences between the nominal US GDP and PPP (purchasing power parity) US GDP:
https://en.wikipedia.org/wiki/List_of_countries_by_GDP_(nominal). With other nations, such as China and India, however, the differences are significant. Using purchasing power parity GDP figures for comparisons yields ratios that more accurately reflect energy intensity and carbon intensity among nations.