Twilight of the Malthusians

Thomas Malthus was an English cleric and scholar living in the early 19th century who developed the theory that global population increases exponentially, while global production increases arithmetically. His theory—and the eventual collapse of civilization that it implies—enjoys influence to this day. In California, it found early expression in a 1976 speech by Governor Jerry Brown, who announced that we had entered an “era of limits.” For more than 40 years now, influential politicians such as Brown, supported by like-minded environmentalists, have embraced the Malthusian vision. But an alternative exists.

First, global population growth was only increasing “exponentially” for a few decades in the middle of the 20th century. As the chart below indicates, using data from the United Nations, the annual rate of global population growth peaked in 1980 at just over 2 percent. Since then, it has already dropped to half that rate, estimated at around 1 percent per year in 2020. By the end of this century, global population is projected to be growing at a decidedly “arithmetic” rate of under 0.2 percent per year.

At the same time that the rate of global population growth is slowing significantly, global productivity continues to increase. Virtually all recent estimates—World BankInternational Monetary FundUnited Nations—forecast global GDP growth to exceed 3 percent per year into the foreseeable future. This rate of growth is low by historical standards and, notwithstanding temporary disruptions caused by future recessions, is likely to be much higher over the next several decades. Put another way, the rate of global wealth creation currently exceeds the rate of human population increase by at least 50 percent, and that ratio is likely to improve over the long-term.

Enough Resources to Sustain Global Economic Growth?

By now, most Malthusians have to acknowledge that global population is leveling off, but they will nonetheless assert that too many people are already here, and there simply aren’t enough resources left on Planet Earth to fuel long-term economic growth. But the prevailing challenge facing humanity when confronted with resource constraints is not that we are running out of resources, but how we will adapt and create new and better solutions to meet the needs that currently are being met by what are arguably scarce or finite resources. If one accepts this premise, that we are not threatened by diminishing resources, but rather by the possibility that we won’t successfully adapt and innovate to create new resources, a completely different perspective on resource scarcity and resource management may emerge.

Across every fundamental area of human needs, history demonstrates that as technology and freedom are advanced, new solutions evolve to meet them. Despite tragic setbacks of war or famine that provide examples to contradict this optimistic claim, overall the lifestyle of the average human being has inexorably improved across the centuries. While it is easy to examine specific consumption patterns today and suggest we now face a tipping point wherein shortages of key resources will overwhelm us, if one examines key resources one at a time, there is a strong argument that such a catastrophe, if it does occur, will be the result of war, corruption, or misguided adherence to counterproductive ideologies, and not because there were not solutions readily available through human creativity and advancing technology.

Energy, water, and land are, broadly speaking, the three resources one certainly might argue are finite and scrupulously must be managed. But in each case, a careful examination provides ample evidence to contradict this claim.

Abundant Energy: According to the most recent BP Statistical Review of World Energy, proven reserves of fossil fuel could provide enough energy to serve 100 percent of worldwide energy requirements at a total annual rate of consumption twice what is currently consumed for at least another 367 years. That is based on adding together the known reserves of the three primary fossil fuels. Using natural gas exclusively, 27 years; oil, 90 years; coal, 250 years. Moreover, additional reserves of fossil fuel are being discovered faster than fossil fuel is being depleted. And this abundance of available fossil fuel is estimated without accounting for vast deposits of so-called unconventional reserves such as methane hydrates.

In addition to fossil fuel, there are proven sources of energy such as nuclear and hydroelectric power, and new sources of energy including wind, solar, geothermal, and biomass, that have the potential to scale up to provide comparable levels of power production. And then there is the eventual promise of limitless, clean fusion power, and perhaps other sources of energy we can’t yet imagine. With these many energy alternatives, combined with relentless improvements in energy efficiency, it is difficult to imagine human civilization ever running out of energy.

Abundant Water: In many regions of the world, the challenge of meeting projected water needs appears more daunting than the challenge of producing adequate energy. But fresh water is not a finite resource. There are countless areas throughout the world where desalination technology can provide water in large quantities—in 2017 over 24 billion cubic meters of the world’s fresh water was obtained through desalination, an amount equivalent to 5 percent of all urban water use worldwide in that year. For large urban users, desalination is affordable and requires surprisingly little energy input.

Another way to provide abundant water is to redirect large quantities of river water via inter-basin transfers from water-rich areas to water poor areas. Finally, water is never truly used up, it is continuously recycled, and by treating and reusing water, particularly in urban areas, there should never be water scarcity.

With water, as with energy, innovation is providing solutions heretofore unimaginable. Densely populated urban areas around the world are turning to high-rise agriculture, where food is grown indoors using water that is perpetually recycled, fertilizer from waste streams, with zero need for pesticides.

Abundant Land: The question of finding adequate land for humans is clearly different from that of finding energy or water, since unlike energy or water, land is truly finite. But even here, key trends indicate land is now becoming more abundant, not less abundant. This is because for decades, all over the world, people have been migrating into densely populated cities. Using World Bank data, as summarized on the bar chart, the global rural population (red) has slowly increased from 2 billion in 1960 to an estimated 3.4 billion in 2020. By 2050, the rural population worldwide is actually expected to decrease, back down to 3.1 billion.

Meanwhile, the global urban population has accommodated nearly all population growth over the past sixty years. These urban populations are concentrated in megacities that, while vast, consume a small fraction of land area on earth. In 1960, humanity’s 1 billion urban dwellers constituted only 34 percent of the global population. By 2050, an estimated 6.6 billion people will live in cities, comprising 68 percent of all humanity. Moreover, this transition has been voluntary. Most people apparently prefer the amenities and opportunities of urban life.

This massive voluntary migration to cities from rural areas, combined with new agricultural innovations, is depopulating landscapes faster than what remains of human population growth will fill them. This seismic shift in the distribution of humans on earth, combined with new high yield cropsaquaculture, and urban high-rise agriculture, promises a decisive and very positive shift from land scarcity to land abundance in the next 25-50 years.

The Ideology of Abundance vs. the Ideology of Scarcity

If one accepts the possibility that humanity is not on a collision course with resource scarcity, entirely new ways of looking at policy options are revealed. Rather than attempting to manage demand, based on the premise that supplies are finite, we might also manage supply by increasing production. While, for example, utility pricing might still be somewhat progressive, if we assume resources will not run out, it doesn’t have to be punitive. If someone wishes to use more energy or water than their neighbor, if their pricing isn’t so punitive as to effectively ration their consumption, but instead is only moderately progressive, then overconsumption leads to higher profit margins at the utility, which in-turn finances more investment in supplies.

Another consequence of rejecting the Malthusian conventional wisdom is a new understanding of what may truly motivate many powerful backers of the doomsday lobby. By limiting consumption through claiming resources are perilously scarce and by extracting them we may destroy the earth, the vested interests who control the means of production will tighten their grip on those means.

Instead of pluralistically investing in this last great leap forward to build megacities and infrastructure for the future—in the process extracting raw materials that either can be recycled or are renewable—the public entities and powerful corporations who benefit from scarcity will raise prices and defer investment. It is the interests of the emergent classes, whether they are entrepreneurs in prosperous, advanced economies, or the aspiring masses in developing nations, which are harmed the most by the Malthusian notion of inevitable scarcity.

Abundance is a choice, and it is a choice the privileged elite must make—in order for humanity to achieve abundance, elites must accept the competition of disruptive technologies, the competition of emerging nations, and a vision of environmentalism that embraces resource development and rejects self-serving anti-growth alarmist extremism. The irony of our time is that the policies of socialism and extreme environmentalism do more harm than good both to ordinary people and the environment, while enabling wealthy elites to perpetuate their position of privilege at the same time as they embrace the comforting but false ideology of scarcity.

This article originally appeared on the website American Greatness.

 *   *   *

New Cable Series “Mars” Lays Leftist Fearmongering Onto a Whole New World

If you haven’t watched, you would think the National Geographic Channel’s cable series “Mars,” would be a straightforward dramatization of human colonization of the Red Planet in the near future. You would be half right.

The show is indeed a well-imagined portrayal of the first colonies on Mars, but rather than being a straightforward dramatization of this exciting next chapter in human civilization, the “Mars” series is saturated with leftist propaganda.

By the end of the second mini-season, which concluded December 17, the messages were clear: humans have brought planet Earth to the brink of apocalyptic ruin—capitalist, climate-denier humans in particular—and they’re going to do the same thing to Mars. They will, that is, unless an underfunded, heroic and beleaguered, transnational band of multicultural warriors with seductive accents manages to stop them.

The contrast down on the Martian surface couldn’t be more obvious. On one side the aforementioned “good” colony of scientists and environmental justice zealots. On the other, the “bad” colony, lavishly funded by the “Lukrum Corporation,” populated by remorseless shills, bent on destroying the fragile ecosystems of Mars for fun and profit.

Just in case this cartoon caricature of ideological struggle extending itself into the solar system isn’t obvious enough, the Martian drama is frequently interrupted with documentary interludes. These segments alternate between sober commentary by climate scientists, warning us of imminent disaster, and the usual images—mountain-sized formations of ice calving into a warming ocean, raging wildfire infernos, and, of course, oil-soaked waterfowl in their final death spasms.

If the rhetoric seems over the top, both in the dramatic dialogue, and in the documentary commentary, that’s because it is. Here are some actual quotes: “Whenever the wealth of the corporations is greater than the wealth of governments, the corporations win.” “People have to join together to rein in the companies.” “Oil is a war against life.” “Big corporations will view Mars as an ‘unfettered’ regulatory environment.” “Science faces skepticism from the public and opposition from the people in power.” “Our mission was to explore this planet, not watch it be exploited by corporate thugs.”

And on, and on, and on, and on, and on. To make their points, National Geographic trots out everyone from Bernie Sanders to Bill Nye the Science Guy, and they touch on everything from climate change to Citizens United. Parents, watch your teenagers; nothing they get in the public schools will contradict this one-sided onslaught.

And what’s the point, if you take this literally? That colonies on Mars, a moonlike, cratered rock with barely a trace atmosphere and no archeological remnants (notwithstanding speculation from ancient astronaut theorists), require environmental impact statements? That Mars might experience catastrophic climate change? That its “ecosystems” must not be disrupted? Really? No. This is television docudrama intended as a convincing metaphor. After all, if we have to be this cautious on Mars, imagine how much more cautious we’re going to need to be here on Earth.

While National Geographic makes transparent use of the eventual settlement of Mars as a metaphor for the ideological conflict currently raging on Earth, this cable television production itself might serve as an apt metaphor as well. Because this TV show is affiliated with—and partially owned by—a ridiculously well-endowed foundation, the National Geographic Society, yet presents its case as if it is arguing against the all-powerful establishment.

This is one of the biggest lies in the entire debate over how to manage resources on Earth: the lie that says the people concerned about “climate change” are the underfunded underdogs, who bravely face the corporate behemoths and their paid-off puppets. Nothing could be further from the truth. The following table shows, for the most recent year for which there is data available, the annual revenue of just a few of the environmentalist nonprofits operating in America.

The National Geographic Society is the largest on this list, but the tail is long. Beyond this sampling, there are thousands of activist nonprofits dedicated to fighting “climate change,” or “smart growth,” or “getting people out of their cars” and promoting mass transit, or “environmental justice,” and so on. To paraphrase Carl Sagan, the man who once said, “terraforming Mars is an idea whose time has gone,” “billions and billions” of dollars are spent each year by environmentalist nonprofits in the United States, and “billions and billions” more around the world.

Environmentalist Nonprofits and Foundations (partial list)

To be fair, much of the work being done by environmentalist nonprofits is valuable and should be supported. Back in the good old days, Greenpeace had one mission: save the whales. And they succeeded. The Sierra Club had its origins in saving what remained of old-growth Sequoiadendron giganteum redwood trees; the club even advocated restrictions on immigration based on the impeccable logic that if millions of people continued to pour into the United States, that would put additional pressure onto ecosystems. But that idea went away as the alliance between the hard Left and the environmentalist movement solidified.

Now, instead of prioritizing efforts to end what are the urgent and genuine environmentalist challenges of today—tropical deforestation to grow “carbon neutral” biofuel, strip-mining the oceans to feed Asia, slaughtering the last herds of Rhinos because supposedly consuming powder from their ground-up horns works better than Viagra, slaughtering apex ocean predators that are essential to marine ecosystems because serving soup containing Shark fin confers status in China, rampant rates of population increases among the most backward, misogynistic societies on Earth—instead these well-heeled environmentalist nonprofits are turning all their firepower towards ending “climate change.”

The irony here is off the chart. Enlisting the financial power and moral credibility of American and international environmentalist organizations in the fight against “climate change” is a corporatist wet dream. Except, oops, it’s not a dream. It’s reality. You see, when it comes to fighting “climate change,” the environmentalists have a lot of help. And why wouldn’t they?

Fighting climate change, as it is interpreted in contemporary society, means you can’t build any more homes on open land. Instead, you have to densify, in order to reduce the “carbon footprint.” This makes established landowners and land developers filthy rich, since only they have the preexisting assets and financial heft to build more homes. It enriches the public sector, as higher property taxes are collected from real estate that has artificially inflated value, and as the real estate portfolios of pension funds soar commensurately.

Fighting climate change means consumers have to buy new cars and new durable appliances, since the old ones waste energy and water, and aren’t “smart.” And speaking of “smart,” fighting climate change means we’ll have to build “smart cities” and the “internet of things,” whereby not only will every aspect of our resource consumption be micro-managed—with “incentives” to reduce usage at algorithmically optimized moments (never mind if you wanted to wash your shirt now, and not when the grid is ready to accommodate you), but you’ll also be micro-surveilled.

Fighting climate change means that international corporations will get a few more profitable quarters, as they sell new automobiles, light rail cars, busses, washers, dryers, ovens, cooktops, water heaters, solar panels, streetlights, grid upgrades, etc., that people will be required by law to buy. And everything from your coffee maker to your toilet will be “wired.” You will not only be mandated to buy these products, but you’ll have to “subscribe” to them in order to facilitate software upgrades. You’ll never really own them. But who wants a dumb washer, after all?

Fighting climate change will mean that public entities will no longer have to build new infrastructure, and will use that money instead to hire more bureaucrats to watch over us, and to pay themselves more. Fighting climate change will mean that all rights to extract and utilize “carbon” will be traded—amidst stupefying corruption and fraud—on an exchange, with the number of extraction credits slowly ratcheted down, allowing the market to set the price per unit. How wonderful.

And while the transnational corporations are getting richer, and political bureaucracies are expanding their reach, and environmentalist organizations continue to swell with virtue, what will happen to the environment—along with possible minor warming, possibly partially contributed to by humans? A lot will happen, that’s what.

Population growth will rage unchecked in the most vulnerable regions of the planet because nobody wanted to be called racist, ocean fisheries will collapse because nobody wanted to stand up to China, forests will be replaced with carbon-neutral corporate plantations because that was the “science-based” policy of choice, and charismatic megafauna will go extinct, because, well, you know why.

While this happens, what will the National Geographic Society be up to? They’ll produce more “climate change” propaganda, purportedly to warn us about corporations and all that.

Yes, “Mars” is a metaphor. But perhaps not the metaphor its producers intended.

This article originally appeared on the website American Greatness.

 *   *   *

The Great Green Wave Hits the American Petri Dish

The Great Green Wave is cresting again. In October, the U.N.’s Intergovernmental Panel on Climate Change released a terrifying special report predicting widespread and imminent climate catastrophe. In November, legacy bureaucrats at the U.S. Environmental Protection Agency released an equally terrifying “Fourth National Climate Assessment.” In both cases, news reports in establishment media included the usual cataclysmic images; starving children, dying cattle with their ribs poking through their emaciated flesh, monstrous masses of ice cascading into the ocean, and raging wildfire infernos.

Needless to say, none of these media reports bothered to explore for possible examples of exaggerated findings, or selective use of data, or political bias, much less any hidden agendas at work. In terms of providing more moderate interpretations of the data, notwithstanding the dismissive coverage of the Trump Administration’s skeptical reaction, consumers of establishment media got nothing. The BBC has now gone so far as to ban any coverage of climate skepticism; the major search engines and social media merely relegate it to the algorithmic backwaters.

Worse, however, is the establishment media’s complete inability to fathom—and report—just how utterly impossible it is to accomplish the goals supposedly required if we are to avoid climate catastrophe. One economic estimate—outlandish but at least as credible as the temperature forecasts—puts the cost of the U.N.’s climate recommendations at over $100 trillion for a reduction of 0.5 degrees centigrade.

But the experts who craft these alarming reports and temperature forecasts aren’t stupid. So what are they really up to?

Economic Development and Governance in the 21st Century
Anyone who hopes to see all the nations of the world achieve the good life enjoyed by developed nations will not have to dig very deep to recognize how hard it’s going to be to meet that challenge. Economic development requires access to affordable energy. And if everyone in the world consumed just half as much energy as the average citizen in the U.S. consumes, worldwide energy production would have to double. This is an undertaking fraught with danger. What kind of energy? Where?

It is easy to imagine dozens of epic disasters as the nations of the world rush headlong towards producing twice as much energy. Toxic air in Beijing. Oil-soaked death zones in the Niger DeltaDeforestation of thousands of square miles of Indonesian rainforest to grow palms to harvest the diesel oil. Wind turbine blades slicing endangered raptors out of the skies, while on the ground their low frequency sound drives humans mad. A generation of children enslaved and slowly poisoned, as they grub their way through filthy open pit mines looking for veins of cobalt in the rocks. Mountains removed to extract the coal. FukushimaDeepwater HorizonThree Gorges. Shall we double the size of this growing list? And yet we have to.

Less imaginable at first glance, but equally dystopian, are efforts rolling out especially in the developed nations to conserve energy. In every primary category of resource consumption, access to affordable abundance—which used to be a defining characteristic of a developed nation—is disappearing. But how can this relentless quest for efficiency be in dispute? Shall Americans continue to consume nearly 20 times as much energy per capita as Africans? Shall we quadruple or quintuple energy production worldwide, instead of merely doubling it, so that everyone can live more like Americans, and so Americans don’t have to sacrifice anything?

This is the charitable explanation for what’s going on. Many of the smartest climate activists know of the fundamental uncertainty in the climate theories they parrot to the masses. For them, climate alarmism is the Noble Lie. It is the best way to scare nations into cleaning up their ecosystems, developing cleaner sources of new energy, and to adopt technologies to more efficiently exploit scarce resources.

The Green New Deal
No analysis of climate alarmism, however, would be complete without the uncharitable explanation for its strength and momentum.

One honest presentation of the broader leftist agenda behind climate alarmism would be the Green New Deal, a product of the U.S. Green Party. Among other things, this sweeping political platform relies on a carbon tax to eliminate unemployment by guaranteeing government jobs to anyone, and going to “100% clean energy by 2030.”

While America’s far-left Green party may have come up with the idea of a Green New Deal, the Democrats are running with it. Led by the far-Left media darling, incoming congresswoman Alexandria Ocasio-Cortez (D-N.Y.), and encouraged by returning House Speaker Nancy Pelosi (D-Calif.), what is certain to generate excitement is the carbon tax. But what will fund all of these government jobs and investment in renewables after 2030, when use of fossil fuel will supposedly be eliminated?

The prospect of increasing taxes in the name of environmental protection is nothing new. But the notion that energy production on the planet can double without significant reliance on fossil fuel is ludicrous. There’s nothing wrong with developing cost-effective renewable alternatives to fossil fuel. There’s nothing wrong with adopting innovations that enable more efficient energy use. But why is it being taken to an extreme? Why are the establishment elites encouraging draconian restrictions on resource production and consumption of all sorts—energy, water, land—in a nation like the United States, where there are ample reserves of all three?

Put simply, how does one explain the paradox whereby the most successful capitalists in the history of the world are promoting what appears to be socialism, complete with rationing and redistribution?

One way to make sense out of this is to imagine Western elites—wealthy individuals, multinational corporations and international investors—as engaging in capitalism on a global scale, while at the same time promoting socialism for the populations under them. Whether or not this socialism is desirable depends on individual expectations. If one is accustomed to working and earning a middle class lifestyle in a developed nation, socialism imposes a crippling burden of high taxes and a high cost-of-living. If one is a destitute immigrant who has recently arrived from a nation where political violence, extreme poverty, and rampant corruption are a way of life, socialism in a developed nation is paradise.

The New American Experiment
The Great Green Wave that’s back at the top of the leftist agenda is part of a larger movement to transform America.

The Green New Deal, complete with carbon taxes and a “wealth tax” on fossil-fuel corporations, as a way to deliver guaranteed jobs and other redistributionist benefits, can be sold to voters by joining together several grassroots factions. Leftists, socialists, thoroughly indoctrinated environmentalist zealots, along with millions of immigrants, are all likely to support the Green New Deal.

The power of this new coalition, despite 50 years of nurturing, is only now poised to become the dominant voting coalition in America. A generation of indoctrinated K-12 students have now reached voting age, having spent their entire childhood enduring ghastly accounts of the earth being destroyed by profit mongering oil companies. Two generations of immigrants, most of them lacking advanced job skills and coming from dirt-poor nations, are also now voting by the millions. These cohorts are joining traditional liberals and turning battleground states blue, one at a time.

The burdens of green socialism will fall onto the shoulders of an American middle class that already faces extinction. American taxpayers already support a military that provides security and the rule of law in nearly every corner of the world. American consumers already pay inflated prices for prescription drugs, in order to fund pharmaceutical research and development that translates into these same drugs being profitably sold at a fraction of that price in the rest of the world. The American middle class subsidizes an overbuilt financial sector, a grossly overpriced system of higher education, and a grossly overpriced unionized public sector. Now, they will pay more for every resource—gas, electricity, water, housing, land—in order to stop climate change.

The opportunities presented by taxing and regulating carbon dioxide in all of its direct and indirect forms of utilization might actually mitigate its sheer oppressiveness. But this money isn’t going to be used to create abundance. It isn’t going to be used to build nuclear power plants all over the world to deliver cheap electricity. It isn’t going to be used for dams, aqueducts, and desalination plants, to refill Lake Chad and the Aral Sea, or to irrigate the Sahel and the Deccan Plateau.

No, it’s going to be used to monitor and micromanage the energy and resource consumption of every individual on earth, expressly starting with what will be an increasingly restive multicultural American populace. And what works in the American petri dish will be rolled out around the world.

From the enabling high-tech multinationals, to compliant mega-corporations in the anointed industries, to international financial firms and wealthy global investors, the Green New Deal and its equivalent across other Western nations will be a gold mine. Meanwhile, grassroots beneficiaries will include public sector workers, transnational bureaucrats, the lucky few who work in the correct industries, and those who had nothing before immigrating to the West. The American middle class—exploited, villainized and voiceless— will descend to the global mean.

What Is Worth Fighting For?
Two questions are worth fighting over. First, is the radical curtailment of fossil fuels really the proper course of action?

What if fossil fuels were cleaned up, so, for example, you could breathe healthy air again in Beijing, but not banned? What if the private sector were simply allowed to develop big new infrastructure around the world, sometimes in partnership with governments, sometimes on their own? What if desalination, water reuse and potable recycling, and other new water infrastructure delivered water abundance, all over the world? What if these supposedly forbidden projects were the best way, and maybe the only way, for human civilization to adapt to climate change by creating wealth and freedom?

Second—and more pertinent, since social cohesion is a prerequisite for having sufficient wealth to even consider how to direct it—to what degree do Americans and other citizens of Western nations deserve to have a higher standard of living than people in the developing world?

To hear the leftist argument, they have no right to a better standard of living, and in fact they should do nothing but atone for the misery they’ve inflicted on the world throughout the centuries. But is this accurate? Is this fair? Isn’t environmentalism a product of Western culture, along with republican democracy, capitalist innovation, nearly all advances in technology, and Christian values of charity and tolerance? Should Americans sacrifice their privileges, if they’ve earned them? Cede their national identity? Become hated strangers in their own land?

Here then, is where an uncharitable explanation for the Great Green Wave is called for.

Why aren’t environmentalists focusing on saving the oceans from overfishing, or wildlife in Africa from poachers, or forests in Indonesia from biofuel plantations? Why aren’t they replanting the mangrove forests that used to protect tropical coasts from storm surges? These are existential threats that are based on facts, not theories that are most definitely not beyond serious debate. Why is climate the prevailing yet futile obsession of our time, if not to thwart the aspirations of emerging nations and the mobility of aspiring individuals? Why shouldn’t we use private sector wealth to invest around the world in practical, cost effective, clean energy solutions including fossil fuel, and accelerate the ascendance of all nations into greater freedom and prosperity?

Why?

The reason is power and profit, justified by comforting and virtuous sounding rhetoric. Sold by international elites to whom all that power and profit will accrue, supported by a voting coalition stacked with the duped, the fanatical, the frightened, and the resentful, and swung to ballot victory by manipulable foreign imports.

 *   *   *


The Immutable Algebra of Global Energy and Population Trends

Compassion for a child in distress is automatic. You do everything you can for that child. You use all the resources you can muster. But what if an entire continent is in distress? What if billions of children are in distress?

This is the question for which there are no easy answers. Because across the developing world, billions of people still endure political violence and extreme poverty. The most afflicted nations are almost always the nations experiencing rapid population increase. And the solutions being proposed, mass immigration and rapid transition to renewable clean energy, require authoritarian, global governance that will rob the people of the developed world of their freedom and prosperity, at the same time as it does little or nothing to help the people living in the developing world. But it is the path of least resistance.

The reason for pursuing flawed solutions has more to do with where the global elites mean to apply authoritarian pressure than with whether or not more lives will be improved, or the planet’s climate will be preserved.

Before exploring alternative solutions, the scope of the challenge should be quantified. The best way to do this is by reviewing trends in global population and energy consumption. The figures to be presented draw on two sources, the World Bank Population Estimates and Projections, and the BP Statistical Review of World Energy.

GLOBAL POPULATION TRENDS

The two pie charts below depict projected global population by region in 2020, and 30 years hence, in 2050. They are sliced by region, with the categories as defined by British Petroleum in their annual energy review. The “Russosphere” refers to the nations of the former Soviet Union that have not joined NATO. The other categories are fairly self explanatory.

As can be seen, more than half of the world’s 7.7 billion people—4.2 billion—live in the Asia/Pacific region, including the demographic heavyweights of China, India, Pakistan, Bangladesh, and Indonesia. As can be seen, five of the other six regions have between 0.3 and 0.5 billion people each. The exception is Africa, with a projected 2020 population of 1.3 billion.

What happens between 2020 and 2050 is extremely significant. First, note the diameter of the second pie chart. The increase in area is exactly proportional to the projected increase in global population between 2020 and 2050. As can be seen, in terms of people inhabiting planet earth, the footprint doesn’t get all that much larger. The world’s population will grow by 25 percent. But where will this growth occur?

The projected population in the Asia/Pacific region will grow by a half-billion, and the population of the six other regions excluding Africa will increase from a total of 2.2 billion in 2020 to 2.5 billion in 2050. Africa, by contrast, will roughly double in population, from 1.3 billion to 2.5 billion. That is, over the three decades between 2020 and 2050, Africa will add 1.2 billion people to its population, whereas the rest of the world combined will add another 0.8 billion.

If projected population growth were spread evenly among nations over the next 30 years, that would pose a different set of challenges. But the problem we face is that between now and 2050, two-thirds of the world’s population growth will occur on the most undeveloped, poverty-stricken continent on earth.

GLOBAL ENERGY TRENDS

To understand just how inadequate current globalist policies are with respect to immigration and energy, especially when facing an exploding population among the most undeveloped nations on earth, global energy trends offer clarity. The next chart shows per capita energy use by region last year. To make the data as intelligible as possible, all energy use—from wood burning to nuclear power—is normalized and expressed in terms of gallons of oil. The differences between regions are profound.

As shown, the average North American—that includes citizens of Canada and Mexico, along with the United States—consumed energy last year equivalent to 1,662 gallons of oil. That’s nearly twice that of the other relatively heavy energy consumers in Europe, the Russosphere, and the Middle East, and it’s nearly four times more than in Central or South America, or in the Asia-Pacific. But take a look at Africa.

The per capita energy consumption by Africans in 2017 was equivalent to 101 gallons of oil. Less than one-sixteenth the amount of energy North Americans consume.

The next chart shows projected global energy use by region in 2020. It is derived from the data shown on the previous pie chart depicting global population by region in 2020, multiplied by per capita energy use by region. The units expressed are “billion tons of oil equivalents,” that is, they depict how much all worldwide energy use would be, if the energy used were exclusively oil.

By the way, for the uninitiated, this is a common practice among energy economists in order to show the relative proportions of energy production and consumption in normalized units. A gallon of gas contains within it 120,429 British Thermal Units, or BTUs, of energy; one kilowatt-hour contains 3,412 BTUs. You can convert all types of energy to, to name a few common examples, BTUs, or joules, or metric tons of oil. Take your pick.

It is obvious from looking at this chart that North America and Europe use far more energy than the global average. Equally obvious is just how small Africa’s slice of global energy consumption is currently, only 3.3 percent of the total despite representing 17.4 percent of global population.

So how will this same chart look in 2050?

GLOBAL ENERGY PRODUCTION NEEDS TO DOUBLE

Below is a pie chart showing one scenario for global energy consumption by region in 2050. First consider the area of the chart, which is exactly twice that of the pie chart for 2020. For the purposes of this analysis, imagine that total energy consumption worldwide will double by 2050. Further suppose that the per capita consumption of energy worldwide will be allocated equally to every human on earth. The implications of these assumptions provide useful insights.

For starters, if energy were consumed equally everywhere, and the total amount consumed were doubled, that would require North Americans to reduce their per capita energy use by 50 percent. In reality, Americans, who consume more energy per capita than Canadians or Mexicans, would have to reduce their per capita energy use by morethan 50 percent.

This bears repeating: If global energy consumption doubled, the per capita energy available worldwide would be less than half of what Americans currently consume.

This isn’t a value judgement. It’s just basic algebra.

Next, note the African slice of this energy consumption pie for 2050. At the energy equivalent of 6.9 billion tons of oil, for the Africans in 2050 to enjoy less than half as much energy as Americans currently enjoy, they would consume a quantity of energy equal to half of all energy consumed worldwide today. And to accomplish this by 2050, energy consumption in Africa would have to increase by a factor of 36. These are mind-boggling statistics. Yet they perfectly illustrate the magnitude of the development challenge facing Africa, insofar as access to affordable energy is one of the prerequisites to reducing poverty.

RENEWABLES VS ALL OF THE ABOVE

It is into the granite face of these immutable demographic and economic facts that the agenda of the renewables lobby collides. Global population and energy trends indicate that the production of energy will need roughly to double in the next 30 years in order to better assure a peaceful evolution of the most economically and politically fragile regions in the world.

The next pie chart, resized down to the 2020 projected total global energy consumption equivalent to 14.4 billion tons of oil, depicts renewables as producing a 0.8 billion-ton-oil equivalent of the total, or 5.6 percent. This 2020 projection, by the way, relies on continued rapid growth of renewables over the next few years, based on the increase of 16.6 percent between 2016 and 2017. In 2017, renewables only provided 3.6 percent of total global energy. These 2020 projections are a best case scenario.

Now imagine this pie chart again doubled in size. Imagine renewables providing 100 percent of this total—the equivalent of 26.7 billion tons of oil. Does that sound ridiculous? Maybe it does, but going “100 percent carbon free” by 2045 is the goal of recent legislation in California. To do this worldwide between 2020 and 2050 would require renewables to increase by a factor of 34 (from 2017 levels, 55).

Imagine wherever you see one windmill, there are 50. Imagine wherever you see a stretch of open space covered with photovoltaics, you see 50 times that much area so covered. Imagine the footprint of these devices, their cradle-to-grave environmental impact. Their contribution to the heat-island effect. Their contribution to avian slaughter, their consumption of land and air. Imagine the ecological impact of producing, maintaining, and reprocessing batteries capable of storing tens of thousands of gigawatts, all over the world. Imagine the cost.

Fact is, we are not going to run out of fossil fuels. At current rates of consumption, proven reserves of oil will last another 179 years; natural gas, 54 years; coal, 505 years. Over the past several years, these reserve ratios, reported on the basis of proven, economically recoverable reserves of fossil fuel resources, have been increasing, not decreasing. “Proven” reserves of conventional fossil fuel will continue to increase into the foreseeable future, without even accounting for vast deposits of so-called unconventional reserves such as methane hydrates. Doubling energy production worldwide within 30 years is a daunting challenge. It is impossible quickly to achieve that goal without fossil fuel, and concern about running out is unfounded.

NO SOLUTIONS ARE EASY

It goes beyond the scope of this analysis thoroughly to assess the cost and environmental impact of installing wind and solar systems, along with grid upgrades and mega-storage. Suffice here to say their environmental impact, their scalability, their sustainability, their practicality, and their cost are all problematic.

Similarly, it goes beyond the scope of this analysis properly to debunk the climate hysteria that is used as cover for this astonishingly flawed approach to delivering adequate energy worldwide. But given the incendiary nature of any flirtation with climate change “denial,” here are links to a few noteworthy climate contrarians: Jo NovaJudith CurryRoger Pielke Jr.Marc Morano, the Heritage Foundation’s Environment website, JunkScience.com, the Science and Environmental Policy ProjectWatts Up With That, and Bjorn Lomborg. Please note: these websites range from blatantly insouciant to eminently measured, but all of them offer valuable information.

It is necessary, however, to connect climate alarmism not only to flawed energy policies, but also to futile immigration policies.

The argument goes something like this: Because imperialist Western nations rapaciously exploited resources in the developing world, they impoverished these nations. At the same time, the Western nations burned fossil fuel, which created droughts and extreme weather in the developing nations, which further worsened their plight. For these reasons, Western nations must admit refugees from developing nations, because if the West had left these countries alone and if the West had not ruined their climates, these nations would be thriving. At the same time, and for the same reasons, Western nations must pay reparations to developing nations, in order for them to recover from the damage caused by the West.

There are two mind-numbingly obvious flaws to this argument, even if you agree with its premises. First, the West cannot possibly absorb hundreds of millions of immigrants. Second, “reparations” in the form of foreign aid, at least to-date, are the real reason the populations in these nations continues to explode. But to propose alternatives, an uncomfortable fact has to be confronted. Africa is a welfare continent, and welfare for Africa has failed.

AFRICA – THE WELFARE CONTINENT

Most evidence gathered over the past 60 years suggests that Africa is a welfare continent in some of the worst connotations of that term. For example, the average number of children in Somalia in 1960 was 7.3, but by the year 2000 that average had actually climbed to 7.6, suggesting that Western food aid and Western medicine lowered the death rate, and lowered infant mortality, but accomplished little in terms of female emancipation, or nurturing indigenous prosperity that correlates with lower birthrates. Somalia is typical.

Burgeoning Nigeria, a nation projected to have 410 million citizens by 2050, saw average fertility decline only slightly, from 6.4 in 1960 to 6.1 in 2000. Fertility in Ethiopia, destined to have nearly 200 million inhabitants by 2050, went from 6.9 in 1960 to 6.5 in 2000. Average fertility in tiny Uganda, where more than 105 million people are expected to reside by 2050, went from 7.0 in 1960 to 6.9 in 2000. Estimates for 2020 are just that: estimates. There is no hard evidence that the population rate of increase in sub-Saharan Africa will slow sufficiently for Africa’s projected population in 2050 to “only” reach 2.5 billion.

The ironic reality is that Africa quite likely would have been better off if no foreign aid, at least as it was formulated, had reached its shores after 1960. Not only did foreign aid play a vital role in enabling Africa’s population to have already more than quintupled since then and now, but to the extent that foreign aid was feeding people in nations that should have been developing their own rich agricultural potential, or providing medical treatment to people in nations that as a consequence had less incentive to train their own doctors, the aid instead went into the pockets of corrupt dictators who had no interest to invest in a brighter future for their nations.

RETHINKING FOREIGN AID, FOREIGN INVESTMENT, AND ENERGY POLICIES

The hard choice comes down to how the powerful Western nations want to apply their wealth and influence to help humanity and heal the planet.

The path we’re on requires shoveling billions in food aid and medical aid to developing nations, with the utterly unsustainable result being exploding populations in societies that don’t evolve and advance internally, because they don’t have to.

The path we’re on requires a parallel campaign to import as many refugees as possible from these developing nations, with the only result being increasing economic burdens on the host nations, and increasing political and cultural conflict in the host nations, with negligible quantitative impact on the destitute and expanding populations of the source nations.

The path we’re on demands a preposterous renunciation of fossil fuel, despite fossil fuel currently providing 85 percent of all global energy, despite the fact that fossil fuel will remain cheap and abundant for at least another generation, if not much longer, and despite the fact that global energy production needs to double in the next 30 years, and nobody has any idea how else that can be accomplished.

Globalism, which underlies these supranational strategies, especially in the context of climate change and immigration, has become a particularly malevolent version of imperialism turned inward. It is an authoritarian response to challenges that are indeed existential—exploding populations of destitute nations, an insatiable global appetite for more energy, and environmental degradation. But it is precisely the wrong response. What happened?

The reason globalism has turned against the populations of developed nations is because that is the path of least resistance. To intervene in Africa, or Honduras, for that matter, with solutions that would work, would revive accusations of imperialism, while simultaneously enraging environmentalists. It is easier for Western elites to blame their own societies for the misery in the developing world. It is easier to import people from the developing world, saturating them with anti-West, redistributionist propaganda, and to bring enough of them in to change the political equation in those nations forever. This strategy is the easiest path towards granting the Western elites carte blanche to continue down the path we’re on. But it’s the wrong path.

The effect of these policies, already well underway, is to exploit the populations of the developed nations, artificially inflating the prices they pay for everything; energy, water, transportation, housing, land, in the name of social equity and saving the planet. The benefit to the elites who own the artificially constrained productive assets is more profit—as costs remain flat and competitive supplies are restricted, profits go up. That is happening today.

The entire scheme is dangerously untenable. Eventually people in the developed nations will rebel—both against the engineered scarcity and against each other in a needlessly fractured culture. And eventually people in developing nations will starve by the millions, if not billions, as Western food and medical aid cannot keep pace with rampant population growth.

Those worried about the climate consequences of the alternative strategy—competitive abundance—should ask themselves what’s worse: a climate that may warm incrementally, possibly due in part to burning of fossil fuel, or another 2 billion people, desperate and destitute, stripping the rainforests for fuel, and wiping out the last great remnants of wild game for the protein.

Western elites must support responsible but competitive and accelerated development of all natural resources, instead of pretending that scarcity will further the goals of social equity and environmentalism. The prosperity that ensues will lead to lower birthrates and urbanization, taking pressure off wildernesses. The increased wealth will fund environmental mitigation.

Western elites must accept the inaccurate but virulent moral opprobrium that will accompany actually investing in places like Africa, as opposed to merely sending food and medical aid. They must embrace compassionate nationalism. They must accept alternatives to the de facto nihilism of mass immigration.

Throughout the developing world, and especially in Africa, Western elites must invest in clean fossil fuel, electricity grids, nuclear power, hydroelectric power, inter-basin water transfers, heavy industry, aquaculture, mega-cities, and universities. To protect their investments, they may have to negotiate charter cities or charter regions with the host nations, where Western laws will be enforceable by Western nations. Achieving stability in these areas won’t be easy. It will invite accusations of imperialism. It may also enable a bright future for not millions, but billions of children.

And maybe it won’t work. But it’s better than the path we’re on.

 *   *   *

Alternatives to the Nihilistic Futility of Mass Immigration

In 1968, Stanford University biologist Paul Ehrlich published The Population Bomb. Ehrlich predicted mass-starvation by the mid-1970s due to an exploding human population outstripping agricultural capacity. Global population in 1968 was 3.5 billion. Today there are 7.6 billion people living on planet earth. Clearly, Ehrlich’s dire predictions were wrong, but the book was a huge bestseller.

In 1987, author and commentator Ben Wattenberg published The Birth Dearth: What Happens When People in Free Countries Don’t Have Enough Babies? In this prescient book, Wattenberg correctly identified the early signs of what is now widely understood—in every developed nation on earth, birthrates are well below replacement levels. Wattenberg’s book didn’t sell nearly as well as Erlich’s. The truth is, Ehrlich wasn’t entirely wrong. Throughout most of the so-called “developing world,” birth rates remain well above replacement levels.

To illustrate his point, Ehrlich made frequent reference to the “doubling time” of a population. It’s an apt concept because it refutes the argument that human innovation and enterprise can accommodate limitless population growth. In a public lecture at Stanford in the 1970s, Ehrlich drew a grim laugh when he explained that eventually unchecked human population growth would result in a solid sphere of human flesh expanding into the universe at the speed of light.

The fact that population growth rates vary among nations, with extremes at both ends, is not sufficiently acknowledged. It is central to discussions of immigration and refugee policies, environmental health, economic models, and the fate of nations and cultures. Yet despite its centrality, exploring practical solutions on this topic invites accusations of racism, ethno-nationalism, even neo-colonialism.

To explain why this discussion cannot be avoided, Ehrlich’s concepts are useful. And alongside exploring the implications of a population’s doubling time, the implications of a population’s “halving time” shall also be included. To provide an example from each extreme, the following cases use data from Somalia for the high-growth scenario, and Japan for the negative growth scenario.

Somalia currently has a population of 11.3 million. On average, women have 6.2 childrenInfant mortality is 8 percentLife expectancy is 55. Their population is projected to increase to 27 million by 2050, a doubling time of under 30 years. At this rate, in just 800 years there would be a Somali standing on every square foot of land area on Earth including Antarctica. In other words, there would be 1.5 trillion Somalis. Can human innovation accommodate this? Perhaps. With high-rise cities and colonies throughout the solar system, why not? But where does this end?

It has to end somewhere. Using Ehrlich’s approach, to visualize what a doubling time of 30 years means, and taking into account the average human body consumes two-cubic feet, within 3,000 years, there would be a solid ball of Somali flesh extending to just beyond the orbit of Jupiter, nearly a billion miles in diameter. In 5,000 years this cosmic flesh ball would exceed the diameter of the Milky Way Galaxy. And within 10,000 years—a span of time that is neatly symmetric with recorded human history—there would be a solid ball of human protoplasm expanding at the speed of light in all directions, on track to absorb the entire known universe.

Based on Japan’s projected population pyramid in 2050, where the population of Japanese aged 75-79 is expected to be more than twice as numerous as those under the age of five, Japan’s population will drop by 50 percent every 70 years. This means that in less than 2,000 years there will be only one Japanese person left in the world. And to extend the metaphor, in less than 5,000 years, what is left of the Japanese people will occupy the volume of one human ovum. The Japanese will disappear into nothingness.

How Japan Copes With Population Decline
These comparisons, while mathematically accurate, are hypothetical to the point of absurdity. But the consequences of these trends are relevant now. How these demographic realities are dealt with in the coming decades will, perhaps more than anything else, define the type of global civilization we leave our children and grandchildren. Examining the policy response by the Japanese to their population decline is useful, since Japan is the only nation on earth with both a homogenous population and a strict policy against mass immigration.

The Japanese have countered their population decline by becoming world leaders in robotics. Their economy, while superficially considered weak due to high debt and monetary deflation, is actually quite robust by other standards. Despite recent setbacks, the Japanese have a history of trade surpluses, meaning their debt is primarily held internally. And because their population is in slow decline, their housing and infrastructure spending is limited to maintenance and upgrades. Their productivity and innovation remain among the highest in the world.

Japan is pioneering an economic model that adapts to a stable, declining population. While this is not necessarily something all nations must accept, it offers important tips for the future. Moderate population growth probably can continue indefinitely, as humanity continues to urbanize and begins to harvest resources elsewhere in the solar system. What is unsustainable and unacceptable, however, is for human populations, anywhere, to continue to double every 30 years.

Somalia’s Population Continues to Explode
How Somalia’s population continues to increase at its current rate is instructive, since it applies more generally to dozens of much larger developing nations across mostly Africa and the Middle East. In the context of a GDP of $7.1 billion, Somalia has an annual trade deficit of $2.1 billion. They receive foreign aid equivalent to 27 percent of GDP, along with remittances sent from Somalis living overseas equivalent to 22 percent of GDP. Nearly half of all Somalis, 46 percent of the population, are “food insecure.”

According to the CIA, “Somalia scores very low for most humanitarian indicators, suffering from poor governance, protracted internal conflict, underdevelopment, economic decline, poverty, social and gender inequality, and environmental degradation. Despite civil war and famine raising its mortality rate, Somalia’s high fertility rate and large proportion of people of reproductive age maintain rapid population growth, with each generation being larger than the prior one. More than 60 percent of Somalia’s population is younger than 25, and the fertility rate is among the world’s highest at almost 6 children per woman—a rate that has decreased little since the 1970s.”

With rare exceptions, Somalia’s situation is mirrored across the continent. Africa’s population has exploded as a result of foreign aid in the form of medicine and food, without commensurate advancements in governance, infrastructure, the rule of law, advanced literacy, technical capacity, individual freedom and internal stability, or any of the other hallmarks of developed nations.

Africa is a welfare continent. In 1960, when most African nations achieved independence, the population of the entire continent was a mere 285 million. Today there are 1.3 billion Africans, and by 2050 Africa’s population is estimated to exceed 2.5 billion.

How Cultures are Altered by Foreign Aid and Welfare
Why the Japanese choose to reduce their population, and why the Somalis choose to increase their population so rapidly, cuts to the heart of cultural issues as much as economic ones. As median income rises, birth rates fall. In a nutshell, that explains the declining populations of developed nations.

But what if instead of affluence, guaranteed subsistence is offered? This describes the impact of foreign aid in Africa, and the result is a sustained population explosion. And as aid falters or is interrupted by war and instability, as the efficacy of aid becomes precarious in direct proportion to the additional hundreds of millions each decade who depend on it, the inevitable result is mass migrations. Which is equally problematic.

In developed nations, a comprehensive system of welfare awaits the migrant. This is completely unlike the challenge of indentured servitude, or at the least, freedom devoid of government assistance, which greeted immigrants to America prior to the 1960s. The result is predictable; a population explosion enabled by welfare, and an immigrant culture where entrepreneurial talent makes the logical choice to work in the informal economy to avoid losing the welfare benefits.

Without indulging in conspiratorial fantasies, the incentives to perpetuate mass migrations are obvious. Immigrant communities that depend on government benefits will vote for Democrats. Somali immigrant Ilhan Omar, recently elected to represent Minnesota’s 5th district, adds to the far-left wing of congressional Democrats. Omar, along with far-left Democrat Keith Ellison who narrowly won election as Minnesota’s new attorney general, were elected with overwhelming support from Minnesota’s burgeoning Somali population. Similar patterns are observable from California to Texas to Florida, and everywhere in between. In America, immigrants from developing countries are turning red states blue, and they are turning blue states bluer.

Current Welfare and Foreign Aid policies are Unsustainable
None of this is sustainable. Socialism, whether through foreign aid to developing nations, or through more government benefits approved with the swing voters coming from developed nations, eventually collapses. Productive citizens, outvoted, overtaxed, and disenfranchised in their own nations, lose their incentives to work hard. This leads to several inevitable conclusions.

First, it is beyond the capacity of developed nations to accommodate ongoing migrations from the developing world. Just the increase in Africa’s population each decade exceeds the entire current population of the United States or Western Europe.

Second, current foreign aid policies are completely unsustainable, because they facilitate this population increase without improving any of the other “humanitarian indicators” that might lead to a cultural shift towards lower birth rates.

Third, while it is possible to decouple economic growth from environmental degradation, the more people there are, the harder that gets. The environmental impact of Africa’s population quadrupling in the last 60 years, and doubling yet again in the next 30 years, is nothing short of catastrophic.

Solutions Exist, But They Won’t Be Easy
French President Emmanuel Macron has been refreshingly blunt about Africa’s challenges. Speaking in Lagos earlier this year, he said, “I am sorry; if you have seven or eight children per woman, even when economic growth is 5 percent, you will never end the fight against poverty. In Europe, centuries ago we had such large families, but ask the women today. If it is their free choice then I am fine but when this situation is due to forced marriage and no education, it is crazy.”

Paul Ehrlich devoted chapters of The Population Bomb to his ideas for how to lower population growth. None of them anticipated the fact that in developed nations, it turned out that affluence was all it took for birth rates to fall voluntarily. Ehrlich’s prescription for the developing world was harsh. He suggested “triage” where nations on a clear path to self-sufficiency would continue to receive food aid, and nations failing this test would have food aid eliminated. But despite its progressive brutality, Ehrlich was recognizing that foreign aid, just like welfare, is unsustainable when the ratio of payers to recipients is relentlessly narrowing.

What can be done?

One controversial idea that deserves development and discussion is the concept of international charter cities. This would involve a nation or coalition of nations being invited into, say, Mogadishu, to set up a zone administered by the visiting nations, subject to their laws and law enforcement. The resulting stability would encourage foreign investment. Over time, these charter cities could become charter regions, where it is conceivable that migrations could be reversed. For example, Somali expatriates, from St. Paul to Sweden, might welcome the chance to return to their homelands to live and work in an area where economic growth and political stability offer them a return to the land and culture they cherish, without sacrificing the safety they found abroad.

Another idea, equally controversial, would be to use foreign aid funds to instead co-invest with private partners in big infrastructure in Africa. For example, within the security of charter regions, constructing nuclear power plants. Or throughout Africa, to invest in economically beneficial infrastructure projects that violate some environmentalist wishes while fulfilling others. An example of such a tradeoff would be an aqueduct to divert water from the Ubangi River to Lake Chad. Just a small percentage of runoff from the mighty Ubangi would restore Lake Chad, enriching the economy and the ecosystems across the Sahel.

Industrializing Africa might actually save the environment, because with economic development, not only are smaller families a welcome consequence so is a cleaner environment. Another demonstrated result of prosperity is the voluntary migration of people from rural areas into cities. With urbanization, economic growth can reduce the footprint of humanity on Africa’s great wildernesses.

The course currently plotted for humanity is alarming. Mass migrations from the developing world will eventually turn developed nations into socialist police states with diminished economies and shattered dreams. Meanwhile, unchecked population growth in the developing world will create political, economic and environmental havoc. It is time for new approaches and clear thinking.

This article originally appeared on the website American Greatness.

 *   *   *

California Burning – How the Greens Turned the Golden State Brown

In October 2016, in a coordinated act of terrorism that received fleeting attention from the press, environmentalist activists broke into remote flow stations and turned off the valves on pipelines carrying crude oil from Canada into the United States. Working simultaneously in Washington, Montana, Minnesota, and North Dakota, the eco-terrorists disrupted pipelines that together transport 2.8 million barrels of oil per day, approximately 15 percent of U.S. consumption. The pretext for this action was to protest the alleged “catastrophe” of global warming.

These are the foot soldiers of environmental extremism. These are the minions whose militancy receives nods and winks from opportunistic politicians and “green” investors who make climate alarmism the currency of their political and commercial success.

More recently, and far more tragic, are the latest round of California wildfires that have consumed nearly a quarter million acres, killed at least 87 people, and caused damages estimated in excess of $10 billion.

Opinions vary regarding how much of this disaster could have been avoided, but nobody disputes that more could have been done. Everyone agrees, for example, that overall, aggressive fire suppression has been a mistake. Most everyone agrees that good prevention measures include forest thinning (especially around power lines), selective logging, controlled burns, and power line upgrades. And everyone agrees that residents in fire prone areas need to create defensible space and fire-harden their homes.

Opinions also vary as to whether or not environmentalists stood in the way of these prevention measures. In a blistering critique published earlier this week on the California-focused Flash Report, investigative journalist Katy Grimes cataloged the negligence resulting from environmentalist overreach.

U.S. Representative Tom McClintock, whose Northern California district includes the Yosemite Valley and the Tahoe National Forest, told Grimes that the U.S. Forest Service 40 years ago departed from “well-established and time-tested forest management practices.”

“We replaced these sound management practices with what can only be described as a doctrine of benign neglect,” McClintock explained. “Ponderous, byzantine laws and regulations administered by a growing cadre of ideological zealots in our land management agencies promised to ‘save the environment.’ The advocates of this doctrine have dominated our law, our policies, our courts and our federal agencies ever since.”

All of this lends credence to Interior Secretary Ryan Zinke’s fresh allegations of forest mismanagement. But what really matters is what happens next.

Institutionalized Environmental Extremism

California’s 2018 wildfires have been unusually severe, but they were not historic firsts. This year’s unprecedented level of destruction and deaths are the result of home building in fire prone areas, and not because of wildfires of unprecedented scope. And while the four-year drought that ended in 2016 left a legacy of dead trees and brush, it was forest mismanagement that left those forests overly vulnerable to droughts in the first place.

Based on these facts, smart policy responses would be first to reform forest management regulations to expedite public and privately funded projects to reduce the severity of future wildfires, and second, to streamline the permit process to allow the quick reconstruction of new, fire-hardened homes.

But neither outcome is likely, and the reason should come as no surprise—we are asked to believe that it’s not observable failures in policy and leadership that caused all this destruction and death, it’s “man-made climate change.”

Governor Jerry Brown is a convenient boogeyman for climate realists, since his climate alarmism is as unrelenting as it is hyperbolic. But Brown is just one of the stars in an out-of-control environmental movement that is institutionalized in California’s legislature, courts, mass media, schools, and corporations.

Fighting climate change is the imperative, beyond debate, that justified the Golden State passing laws and regulations such as California Environmental Quality Actthe Global Warming Solutions Act of 2006the Sustainable Communities and Climate Protection Act of 2008, and numerous others at the state and local level. They make it nearly impossible to build affordable homes, develop energy, or construct reservoirs, aqueducts, desalination plants, nuclear power plants, pipelines, freeways, or any other essential infrastructure that requires so much as a scratch in the ground.

Expect tepid progress on new preventive measures, in a state so mired in regulations and litigation that for every dollar spent paying heavy equipment operators and loggers to do real work, twice that much or more will go to pay consultants, attorneys, and public bureaucrats. Expect “climate change” to be used as a pretext for more “smart growth,” which translates into “stack and pack,” whereby people will be herded out of rural areas through punishing financial disincentives and forced into densely populated urban areas, where they can join the scores of thousands of refugees that California is welcoming from all over the world.

Ruling Class Hypocrisy

Never forget, according to the conventional wisdom as prescribed by California’s elites, if you don’t like it, you are a climate change “denier,” a “xenophobe,” and a “racist.”

California’s elites enjoy their gated communities, while the migrants who cut their grass and clean their floors go home to subsidized accessory dwelling units in the backyards of the so-called middle class whose taxes pay for it all. They are hypocrites.

But it is these elites who are the real deniers.

They pretend that natural disasters are “man-made,” so they can drive up the cost of living and reap the profits when the companies they invest in sell fewer products and services for more money in a rationed, anti-competitive environment.

They pretend this is sustainable; that wind farms and solar batteries can supply adequate power to teeming masses crammed into power-sipping, “smart growth” high rises. But they’re tragically wrong.

Here the militant environmentalists offer a reality check. Cutting through their predictable, authoritarian, psychotically intolerant rants that incorporate every leftist shibboleth imaginable, the “Deep Green Resistance” website offers a remarkably lucid and fact-based debunking of “green technology and renewable energy.” Their solution, is to “create a life-centered resistance movement that will dismantle industrial civilization by any means necessary.”

These deep green militants want to “destroy industrial civilization.” At their core, they are misanthropic nihilists—but at least they’re honest. By contrast, California’s stylish elites are driving humanity in slow motion towards this same dire future, cloaked in denial, veiled coercion, and utopian fantasies.

This is the issue that underlies the California wildfires, what causes them and what to do about them. What is a “sustainable” civilization? One that embraces human settlements, has faith in human ingenuity, and aspires to make all humans prosperous enough to care about the environment, everywhere? Or one that demands Draconian limits on human settlement, with no expectation that innovation can provide solutions we can’t currently imagine, and condemns humans to police-state rationing of everything we produce and consume?

That is the stark choice that underlies the current consensus of California’s elites, backed up by dangerous and growing cadres of fanatical militants.

This article originally appeared on the website American Greatness.

 *   *   *


Towards a Grand Bargain on California Water Policy

When it comes to water policy in California, perhaps the people are more savvy than the special interests. Because the people, or more precisely, the voters, by huge majorities, have approved nine water bonds in the past 25 years, totaling $27.1 billion. It is likely they’re going to approve another one this November for another $8.9 billion.

The message from the people is clear. We want a reliable supply of water, and we’re willing to pay for it. But the special interests – or whatever you want to call the collection of politicians, unelected bureaucrats with immense power, and other stakeholders who actually decide how all this money is going to be spent – cannot agree on policy. A recent article in the Sacramento Bee entitled “Why San Francisco is joining Valley farmers in a fight over precious California water,” says it all. “Precious California water.” But what if water were so abundant in California, it would no longer be necessary to fight over it?

As it is, despite what by this time next year is likely to be $36 billion in water bonds approved by voters for water investments since 1996, the state is nowhere close to solving the challenge of water scarcity. As explained in the Sacramento Bee, at the same time as California’s legislature has just passed long overdue restrictions on unsustainable groundwater withdrawals, the political appointees on the State Water Resources Control Board are about to enact sweeping new restrictions on how much water agricultural and municipal consumers can withdraw from the Sacramento and San Joaquin rivers.

This is a perfect storm, and every conservation, recycling and storage project currently funded or proposed will not make up the shortfall. In 2002, well before these new restrictions were being contemplated, the California Dept. of Water Resources issued an authoritative study, “Averting a California Water Crisis,” that estimated the difference between demand and supply at between two and six million acre feet per year by 2020. An impressive response from the public during the most recent drought, combined with some investment in water infrastructure has narrowed that gap. But the squeeze is ongoing, with tougher challenges and tradeoffs ahead.

Abundance vs Scarcity

When thinking about solutions to California’s water challenges, there is a philosophical question that has to be addressed. Is it necessary to persistently emphasize conservation over more supplies of water? Is it necessary to always perceive investments in more supplies of water as environmentally unacceptable, or is it possible to decouple, or mostly decouple, environmental harm from investment in more water supplies? Is it possible that the most urgent environmental priorities can be addressed by increasing the supply of water, even if investing in more water supplies also creates new, but lessor, environmental problems?

This philosophical question takes on urgent relevance when considering not only the new restrictions on water withdrawals that face Californians, but also in the context of another great philosophical choice that California’s policy makers have made, which is to welcome millions of new immigrants from across the world. What sort of state are we inviting these new residents to live in? How will we ensure that California’s residents, eventually to number not 40 million, but 50 million, will have enough water?

It is this reality – a growing population, a burgeoning agricultural economy, and compelling demands to release more water to threatened ecosystems – that makes a grand political water bargain necessary for California. A bargain that offers a great deal for everyone – more water for ecosystems, more water for farmers, more water for urban consumers – because new infrastructure will be constructed that provides not incremental increases, but millions and millions of acre feet of new water supplies.

The good news? Voters are willing to pay for it.

How to Have it All – A Water Infrastructure Wish List

When considering what it would take to actually have water abundance again in California, the first step is to try to determine the investment costs, imagining a best case scenario where every good idea got funded. Here’s a stab at that list, not differentiating between local, state and federal projects. These are very approximate numbers, rounded upwards to the nearest billion:

Projects to Increase Supplies of Water

(1) Build the Sites Reservoir (annual yield 0.5 MAF) – $5.0 billion.

(2) Build the Temperance Flat Reservoir (annual yield 0.25 MAF) – $3.0 billion.

(3) Raise the height of the Shasta Dam (increased annual yield 0.5 MAF) – $2.0 billion.

(4) So Cal water recycling plants to potable standards with 1.0 MAF capacity – $7.5 billion.

(5) So Cal desalination plants with 1.0 MAF capacity – $15.0 billion.

(6) Desalination plants on Central and North coasts with 0.5 MAF capacity – 7.5 billion

(7) Central and Northern California water recycling plants to potable standards with 1.0 MAF capacity – $7.5 billion.

(8) Facilities to capture runoff for aquifer recharge (annual yield 0.75 MAF) – $5.0 billion.

Total – $52.5 billion.

Projects to Increase Resiliency of Water Distribution Infrastructure

(9) Retrofit every dam in California to modern standards, including Oroville and San Luis – $5.0 billion.

(10) Aquifer mitigation to eliminate toxins with focus on Los Angeles Basin – $7.5 billion.

(11) Retrofit of existing aqueducts – $5 billion.

(12) Seismic retrofits to levees statewide, with a focus on the Delta – $7 billion.

Total – $24.5 billion.

The total of all these projects, $77 billion, is not accidental. That happens to be the latest best case, low-ball estimate for California’s completed high speed rail project. Without belaboring the case against high speed rail, two comparisons are noteworthy.

First, an ambitious program to create water abundance in California and water infrastructure resiliency in California based on this hypothetical budget is achievable. These numbers are deliberately rounded up, and the final costs might actually be lower, whereas it is extremely unlikely that California’s high speed rail project can be completed for $77 billion.

Second, because people will actually consume these new quantities of water that are being supplied and delivered, private financing will be attracted to significantly reduce the taxpayer’s share.

The Impact of a $77 billion Investment on Water Supply, Resiliency, and Ecosystems

As itemized above, at a capital cost of $52.5 billion, the total amount of water that might be added to the California’s statewide annual water budget is 5.5 million acre feet.

This amount of water would have a staggering impact on the demand vs. supply equilibrium for water. It is nearly equal to the total water consumed per year by all of California’s urban centers. Implementing this plan would mean that nearly all of the water that is currently diverted to urban areas could be instead used to ensure a cool, swift flow in California’s rivers, while preserving current allocations for agriculture. The options for environmentalists would be almost unbelievable. Restore wetlands. Revive the Delta. Refill the shrinking Salton Sea.

The environmentalist arguments against the three dams are weak. Shasta Dam is already built. The impact of expanding the Shasta Dam is purportedly the worst on McCloud creek, where it will affect “nearly a mile” of what was “once a prolific Chinook salmon stream,” (italics added). That negative impact, which seems fairly trivial, has to be balanced against the profound benefit of having another 500,000 acre feet of water available every summer to generate pulses of swift, cool water in the Sacramento River. The proposed Temperance Flat Reservoir is proposed on a stretch of the San Joaquin River that already has a smaller dam. The Sites Reservoir is an offstream reservoir that will not interfere with the Sacramento River.

The environmental benefits of these dams are not limited to their ability to ensure supplies of fresh water for California’s aquatic ecosystems. They can also be used to store renewable electricity, by pumping water from a forebay at the foot of the dam into the reservoir during the day, when solar energy already brings the spot price of electricity down to just a few cents per kilowatt-hour, then generating hydro-electric power later in the evening when peak electrical demand hits the grid. This well established technology has already been implemented on dams throughout California, and remains one of the most cost-effective ways to store clean, but intermittent, renewable energy. It will also be a profit center for these dams.

The environmentalist arguments against desalination are also weak. The energy required to desalinate seawater is comparable to the energy necessary to pump it from Northern California to the Los Angeles Basin. The outfall can be discharged under pressure a few miles from shore, where it is instantly disbursed in the California current. The impact from the intakes is grossly overstated by environmentalists, when considering that even if all of these contemplated desalination plants were built, the water they would intake is only a fraction of the amount of water taken in for decades by California’s power plants that are sited on the coast and use seawater for cooling.

As for the Delta, the primary environmental threat to that ecosystem is the chance that an earthquake destroys the hundreds of miles of levees, causing the agricultural areas behind those levees to be flooded. Not only would agricultural contaminants enter the water of the Delta, but the rush of water flooding into the areas behind the levees would cause salt water from the San Francisco Bay to rush in right behind, creating conditions of salinity that would take years to remove, if ever.

This is why investing in levee upgrades and a Delta Smelt hatchery is a preferable solution to the Delta tunnels. The tunnels would ensure a resilient supply of water from north to south, but the Delta would still be vulnerable to levee collapse. Levee upgrades and a Delta Smelt hatchery would accomplish both goals – resiliency of the water supply and of the Delta ecosystem. Moreover, the presence of massive water recycling and desalination facilities in Southern California would take a great deal of pressure off how much water would need to be transported through the Delta from north to south.

How to Finance $77 Billion for Water Infrastructure

Funding capital projects depends on three possible sources: operating budgets, general obligation bonds, or revenue bonds. Operating budgets, which used to help pay for capital projects, and which ought to help pay for capital projects, will never be balanced until real pension reform occurs. So for the most part, operating budgets are not a source of funds.

A useful way to differentiate between general obligation bonds and revenue bonds are that the general obligation bonds impose a progressive tax on Californians, since wealthy individuals pay about 60% of all tax revenues in California. Revenue bonds, on the other hand, because they are serviced through sales of, for example, water produced by a desalination plant, are regressive. This is because all consumers see these costs included in their utility rates, and utility bills constitute a far greater proportion of the budget for a low income household.

The Grand Bargain – Creating Water Abundance in California
(MAF = million acre feet)

By financing water infrastructure through a combination of revenue bonds and general obligation bonds, instead of solely through revenue bonds, water can remain affordable for ordinary Californians. The $24.5 billion portion of the $77.0 billion wish list, the funds for dam, aqueduct, and levee retrofits, along with aquifer mitigation, are not easily serviced through revenue bonds. A 30 year general obligation bond for $24.5 billion with an interest rate of 5% would cost California’s taxpayers $1.6 billion per year. Some of these projects, to the extent they are improving water delivery to specific urban and agricultural consumers, might be funded by bond issuances that would be serviced by the agencies most directly benefiting.

To claim that 100% of the revenue producing water projects can be financed through revenue bonds is more than theoretical. The Carlsbad Desalination Plant financing costs, principle and interest payments a nearly $1.0 billion for the plant’s construction, are paid by the contractor that built and operates the plant, with those payments in-turn funded through the rates charged to the consumers of the water. The contractor also retains an equity stake in the project, meaning that additional capital costs incurred privately are also funded via a portion of the rates charged to consumers.

Some of the revenue producing assets on the grand bargain wish list may also have a portion of them paid for by general obligation bonds. Determining that mix depends on the consumer. For example, a revenue bond for the reservoir projects may be applied to agricultural consumers who are willing to pay well above historical rates to have a guaranteed source of water for their orchards, which have to survive through dry years.

For urban consumers in particular, making the more expensive projects financially palatable may require general obligation bonds to cover part of the costs, so the remaining costs are affordable for ratepayers. For example, desalination is a relatively expensive way to produce water, making it harder to finance 100% with revenue bonds. But without desalination, wastewater recycling and runoff capture are not sufficient local sources of water in places like Los Angeles. The overall benefit to Californians of adding another 1.5 million acre feet per year to the state’s water supply, using desalination which is impervious to droughts, may be worth having some of its cost financed with general obligation bonds.

To fund roughly 50% of the revenue producing water supply infrastructure ($26.2 billion) and 100% of the water resiliency and distribution infrastructure ($24.5 billion) on this list would cost taxpayers about $3.0 billion per year. While this might strike some as an unthinkable amount to even consider, these projects meet all the criteria for so-called “good debt.” Constructing them all would solve California’s challenge of water scarcity, possibly forever. All of the projects are assets yielding ongoing and long-term benefits that will outlast the term of the financing. At the same time, water would become so abundant in California that prioritizing water allocations to revive ecosystems would no longer provoke bitter opposition. And California’s residents would live again in a state where taking a long shower, planting a lawn, and doing other water-intensive activities that are considered normal in a developed nation, would once again become affordable and normal.

Other Ways to Help Pay for Water Abundance in California

Enable and Expand Water Markets

Even if a grand bargain is struck between environmentalists, farmers, and water districts, and massive investments are made to increase the supply of water, enabling and expanding water markets will help optimize the distribution of available water resources. Similarly, reforming California’s labyrinthine system of water rights might also help, by making it easier for owners of water rights to sell their allocations. Fostering water markets while protecting water rights have interrelated impacts, and ideally can result in more equitable, appropriate water pricing across the state. It might also help make it unnecessary to impose punitive tiered rates or rationing on household consumers.

Reform Environmentalist Barriers to Development

CEQA, or the California Environmental Quality Act, is a “statute that requires state and local agencies to identify the significant environmental impacts of their actions and to avoid or mitigate those impacts, if feasible.” While the intent behind CEQA is entirely justifiable, in practice it has added time and expense to infrastructure projects in California, often with little if any actual environmental benefit. An excellent summary of how to reform CEQA appeared in the Los Angeles Times in Sept. 2017, written by Byron De Arakal, vice chairman of the Costa Mesa Planning Commission. It mirrors other summaries offered by other informed advocates for reform and can be summarized as follows:

  • End duplicative lawsuits: Put an end to the interminable, costly legal process by disallowing serial, duplicative lawsuits challenging projects that have completed the CEQA process, have been previously litigated and have fulfilled any mitigation orders.
  • Full disclosure of identity of litigants: Require all entities that file CEQA lawsuits to fully disclose their identities and their environmental or, increasingly, non-environmental interest.
  • Outlaw legal delaying tactics: California law already sets goals of wrapping up CEQA lawsuits — including appeals — in nine months, but other court rules still leave room for procedural gamesmanship that push CEQA proceedings past a year and beyond. Without harming the ability of all sides to prepare their cases, those delaying tactics could be outlawed.
  • Prohibit rulings that stop entire project on single issue: Judges can currently toss out an entire project based on a few deficiencies in environmental impact report. Restraints can be added to the law to make “fix-it ticket” remedies the norm, not the exception.
  • Loser pays legal fees: Currently, the losing party in most California civil actions pays the tab for court costs and attorney’s fees, but that’s not always the case with CEQA lawsuits. Those who bring CEQA actions shouldn’t be allowed to skip out of court if they lose without having to pick up the tab of the prevailing party.

Find Other Ways to Reduce Construction Costs

The Sorek desalination plant, commissioned in Israel in 2015, cost $500 million to build and desalinates 185,000 acre feet of water per year. Compared to Carlsbad, which also began operations in 2015, Sorek came online for an astonishing one-sixth the capital cost per unit of capacity. Imagine if the prices Israelis pay to construct desalination plants could be achieved in California. Instead of spending $15 billion to build 1.0 million acre feet of desalination capacity, we would spend less than $3.0 billion. How did they do this?

The bidding process itself adds unnecessary costs to public infrastructure projects. Moving to a design-build process could significantly reduce duplicative work during the plant’s engineering phase. Project labor agreements are another practice that at the very least deserve serious reconsideration. Would it be possible objectively evaluate the impact of project labor agreements, and determine to what extent those mandates increase costs?

What about economies of scale? If ten desalination plants were commissioned all at once, wouldn’t there be an opportunity for tremendous unit savings? What about creativity? Elon Musk, who has disrupted the aerospace industry by building rockets at a fraction of historical prices, said “the construction industry is one of the only sectors in our economy that has not improved its productivity in the last 50 years.” Is he even partly correct? Is that worth looking into?

Shift Government Spending Priorities

Cancel High Speed Rail: The most obvious case of how to redirect funds away from something of marginal value into water infrastructure, which is something with huge public benefit, is to cancel the bullet train. The project is doomed anyway, because it will never attract private capital. But what if Californians were offered the opportunity to preserve the planned bond issuances for high speed rail, tens of billions of capital, but with a new twist? If voters were asked to redirect these funds away from high speed rail and instead towards creating water abundance through massive investment in water infrastructure, there’s a good chance they’d vote yes.

Cancel the Delta Tunnels: By investing in levee hardening, the Delta’s ecosystems can be fortified against a severe earthquake. Reducing the possibility of levee failure protects the Delta ecosystems from their worst environmental threat at the same time as it protects the ability to transfer water from north to south. Investing in hatcheries to increase the population of the threatened Smelt is a far more cost-effective way of safeguarding the survival of that species. And investing in infrastructure on the Southern California coast to make that region water independent greatly reduces the downside of a disruption to water deliveries through the Delta. Canceling the Delta Tunnels would save $20 billion, money that would go a long way towards paying for other vital water infrastructure.

Reform Pensions: The biggest out of control budget item, by far among California’s state and local agencies, is the cost of public sector pensions. A California Policy Center analysis released earlier this year, based on public announcements from CalPERS, estimated that the total employer payments for pensions for California’s state and local government employees is set to nearly double, from $31 billion in 2018 to $59 billion by 2024. And that is a best case baseline. If there is a severe market correction, those required contributions will go up further. No discussion of how to find money for other government operations can take place without understanding the role of pension costs in creating budget constraints.

Reduce State Spending: Other ways to shift spending priorities in California, while worth a discussion, are mostly controversial. Returning the administrator to faculty ratio in California’s UC and CalState systems to its historical level of 1:2 instead of the current 1:1 would also save $2.0 billion per year. Outsourcing CalTrans work and eliminating redundant positions could save $2.5 billion per year. Reducing just state agency headcount and pay/benefits by 20% would save $6.5 billion per year. Just enacting part of that, incremental pension reform for state workers, could stop the runaway cost increases that are otherwise inevitable.

California’s state budget this year has broken $200 billion for the first time. Of that, general fund spending is at $139 billion, also a record. Revenues, however, have set records as well. The rainy day fund is full, and an extra deposit of $2.6 billion has it overflowing. Why not spend that $2.6 billion on water infrastructure? For that matter, why not spend all of the $1.4 billion of cap and trade revenue on water infrastructure?

Financing more water infrastructure will more likely come via public and private debt financing. But redirecting intended future borrowings, in particular for high speed rail and for the Delta Tunnels, could cover most if not all of the infrastructure investments necessary to deliver water abundance to Californians. And at the least, redirecting funds from government operating budgets can defray some of the operating costs, if not some of the capital costs.

Work to Build a Consensus

How many more times will California’s voters approve multi-billion dollar water bonds? The two passed in the last four years, plus the current one set for the November ballot, raise $20 billion, but only $2.5 billion of that goes to reservoir storage. Only another $3.3 billion more goes to any type of supply enhancements – mostly to develop aquifer storage or fund water recycling. Meanwhile, consumers are being required to submit to permanent water rationing, and dubious projects are being funded to save water. Artificial turf is a good example. There isn’t a coach in California who wants their athletes to compete on these dangerous surfaces. On a hot day in Sacramento, the temperature on these “fields” can reach 150 degrees. They are actually keeping sprinkler systems operating on these horrendous boondoggles, just to reduce the deadly heat buildup.

Credibility with voters remains intact to-date, but cannot be taken for granted. If a grand bargain on California’s water future is struck, it will need to promise, then deliver, water abundance to California’s residents.

Change the Conventional Wisdom

California’s current policies have stifled innovation and created artificial scarcity of literally every primary necessity – not just water, but housing, energy and transportation. Each year, to comply with legislative mandates, California’s taxpayers are turning over billions of dollars to attorneys, consultants and bureaucrats, instead of paying engineers and heavy equipment operators to actually build things. The innovation that persists despite California’s unwelcoming policy environment is inspiring.

California’s policymakers have adhered increasingly to a philosophy of limits. Less water consumption. Less energy use. Urban containment. Densification. Fewer cars and more mass transit. But it isn’t working. It isn’t working because California has the highest cost of living in the nation. Using less water and energy never rewards consumers, because the water and energy never were the primary cost within their utility bills – the cost of the infrastructure and overhead was the primary cost.

Changing the conventional wisdom applies to much more than water. It is a vision of abundance instead of scarcity that encompasses every vital area of resource consumption. A completely different approach that could cost less than what it might cost to fully implement scarcity mandates. An approach that would improve the quality of life for all Californians. Without abandoning but merely scaling back the ambition of new conservation and efficiency mandates, embrace supply oriented solutions as well. Build wastewater recycling and desalination plants on the Pacific coast, enough of them to supply California’s massive coastal cities with fresh water. Instead of mandating water rationing for households, put the money that would have been necessary to retrofit all those homes into new ways to reuse water and capture storm runoff.

Paying for all of this wouldn’t have to rely exclusively on public funds. Private sector investment could fund a large percentage of the costs for new water infrastructure. Water supplies could be even more easily balanced by permitting water markets where farmers could sell their water allotments without losing their grandfathered water rights. If the bidding process and litigation burdens were reduced, massive water supply infrastructure could be constructed at far more affordable prices.

The Grand Bargain

Water abundance in California is achievable. The people of California would welcome and support a determined effort to make it a reality. But compromise on a grand scale is necessary to negotiate a grand bargain. Environmentalists would have to accept a few more reservoirs and desalination plants in exchange for plentiful water allocations to threatened ecosystems. Farmers would have to pay more for water in exchange for undiminished quantities. While private financing and revenue bonds could cover much of the expense, taxpayers would bear the burden of some new debt – but in exchange for permanent access to affordable, secure, and most abundant water.

This is the third and final part of an investigation into California’s water future. Part one is “How Much California Water Bond Money is for Storage?,” and part two is “How to Make California’s Southland Water Independent for $30 Billion.” Edward Ring is a co-founder of the California Policy Center and served as its first president.

 *   *   *

How to Make California’s Southland Water Independent for $30 Billion

The megapolis on California’s southern coast stretches from Ventura County on the northern end, through Los Angeles County, Orange County, down to San Diego County on the border with Mexico. It also includes the western portions of Riverside and San Bernardino counties. Altogether these six counties have a population of 20.5 million residents. According to the California Department of Water Resources, urban users consume 3.7 million acre feet of water per year, and the remaining agricultural users in this region consume an additional 700,000 acre feet.

Much of this water is imported. In an average year, 2.6 million acre feet of water is imported by the water districts serving the residents and businesses in these Southland counties. The 701 mile long California Aqueduct, mainly conveying water from the Sacramento River, contributes 1.4 million acre feet. The 242 mile long Colorado River Aqueduct adds another 1.0 million acre feet. Finally, the Owens River on the east side of the Sierras contributes 250,000 acre feet via the 419 mile long Los Angeles Aqueduct.

California’s Plumbing System
The major interbasin systems of water conveyance, commonly known as aqueducts

California’s Overall Water Supplies Must Increase

Californians have already made tremendous strides conserving water, and the potential savings from more stringent conservation mandates may not yield significant additional savings. Population growth is likely to offset whatever remaining savings that may be achievable via additional conservation.

Meanwhile, the state mandated water requirements for California’s ecosystems continue to increase. The California State Water Board is finalizing “frameworks” that will increase the minimum amount of flowrequired to be maintained in the Sacramento and San Joaquin rivers order to better protect fish habitat and reduce salinity in the Delta. And, of course, these rivers, along with the Owens and Colorado rivers, are susceptible to droughts which periodically put severe strain on water users in California.

At about the same time, in 2015, California’s legislature began regulating groundwater withdrawals. This measure, while long overdue, puts additional pressure on urban and agricultural users.

California’s water requirements for healthy ecosystems, a robust and growing farm economy, as well as a growing urban population, are set to exceed available supply. Conservation cannot return enough water to the system to fix the problem.

How Can Water Supplies Increase?

In Southern California, runoff capture is an option that appears to have great potential. Despite its arid climate and perennial low rainfall, nearly every year a few storm systems bring torrential rains to the South Coast, inundating the landscape. Until the Los Angeles River was turned into a gigantic culvert starting in 1938, it would routinely flood, with the overflow filling huge aquifers beneath the city. Those aquifers remain, although many are contaminated and require mitigation. Runoff harvesting for aquifer storage represents one tremendous opportunity for Southern Californians to increase their supply of water.

The other possibilities are sewage recycling and desalination. In both cases, Southern California already boasts some of the most advanced plants in the world. The potential for these two technologies to deliver massive quantities of potable water, over a million acre feet per year each, is now predicated more on political and financial considerations than technological challenges.

Recycling Waste Water

Orange County leads the United States in recycling waste water. The Orange County Sanitation District treats 145,000 acre feet per year (130 million gallons per day – “MGD”), sending all of it to the Orange County Water District’s “Ground Water Replenishment System” plant for advanced treatment. The GWRS plant is the biggest of its kind in the world. After being treated to potable standards, 124,000 acre feet per year (110 million GPD), or 85 percent of the waste water, is then injected into aquifers to be stored and pumped back up and reused by residents as potable water. The remainder, containing no toxins and with fewer total dissolved solids than seawater, is discharged harmlessly into the ocean.

Currently the combined water districts in California’s Southland discharge about 1.5 million acre feet (1.3 billion GPD) of treated wastewater each year into the Pacific Ocean. Only a small percentage of this discharge is the treated brine from recycled water. But by using the advanced treatment methods as are employed in Orange County, 85% of wastewater can be recycled to potable standards. This means that merely through water reuse, there is the potential to recycle up to another 1.2 million acre feet per year.

Needless to say, implementing a solution at this scale would require major challenges to be overcome. Currently California’s water districts are only permitted to engage in “indirect potable reuse,” which means the recycled water must be stored in an aquifer or a reservoir prior to being processed as drinking water and entering the water supply. By 2023, it is expected the California Water Board will have completed regulations governing “direct potable reuse,” which would allow recycled water to be immediately returned to the water supply without the intermediate step of being stored in an aquifer or reservoir. In the meantime, it is unlikely that there are enough uncontaminated aquifers or available reservoirs to store the amount of recycled water that could be produced.

Desalinating Seawater

The other source of new water for Southern California, desalination, is already realized in an operating plant, the Carlsbad Desalination Plant in San Diego County. This plant produces 56,000 acre feet per year (50 MGD) of fresh water by processing twice that amount of seawater. It is the largest and most technologically advanced desalination plant in the Western Hemisphere. It is co-located with the Encina Power Station, a facility that uses far more seawater per year, roughly ten times as much, for its cooling systems. The Carlsbad facility diverts a portion of that water for desalination treatment, then returns the saltier “brine” to the much larger outflow of cooling water at the power plant.

Objections to desalination are many, but none of them are insurmountable. The desalination plant proposed for Huntington Beach, for example, will not have the benefit of being co-located with a power plant that consumes far more seawater for its cooling system. Instead, this proposed plant – which will have the same capacity as the Carlsbad plant – will use a large array of “wet filters” situated about 1,500 feet offshore, on the seabed about 40 feet below the surface, to gently intake seawater that can be pumped back to the plant without disrupting marine life. The outgoing brine containing 6 percent salt (compared to 3% in seawater) will be discharged under pressure from an underwater pipe extending about 1,800 feet offshore. By discharging the brine under pressure, it will be instantly disbursed and immediately dissipated in the powerful California current.

While desalination is considered to be energy intensive, a careful comparison of the energy cost to desalinate seawater reveals an interesting fact. It takes a roughly equivalent amount of electricity to power the pumps on the California aqueduct, where six pumping stations lift the water repeatedly as it flows from north to south. To guarantee the water flows south, the California aqueduct is sloped downward by roughly one foot per mile of length, meaning pump stations are essential. The big lift, of course, is over the Tehachapi Mountains, which is the only way to import water into the Los Angeles basin.

Barriers to Implementation – Permitting & Lawsuits

The technological barriers to large scale implementation of water recycling and desalination, while significant, are not the primary impediments. Permitting and financing are far bigger challenges. Moreover, financing costs for these mega projects become more prohibitive because of the difficulties in permitting.

The process necessary to construct the proposed Huntington Beach Desalination Plant is illustrative of just how difficult, if not impossible, it is to get construction permits. The contractor has been involved in the permitting process for 16 years already, and despite significant progress to-date, still expects approval, if it comes, to take another 2-3 years.

One of the problems with permitting most infrastructure in California is that several agencies are involved. These agencies can actually have conflicting requirements. Applicants also end up having to answer the same questions over and over, because the agencies don’t share information. And over the course of decades or more, the regulations change, meaning the applicant has to start the process over again. Compounding the difficulties for applicants are endless rounds of litigation, primarily from well-funded environmentalist organizations. The failure to-date of California’s lawmakers to reform CEQA make these lawsuits potentially endless.

Barriers to Implementation – Financing

Even if permitting were streamlined, and all technical challenges were overcome, it would be a mistake to be glib about financing costs. Based on the actual total cost for the Carlsbad desalination plant, just under $1.0 billion for a capacity of 56,000 acre feet per year, the capital costs to desalinate a million acre feet of seawater would be a daunting $18.0 billion. On the other hand, with permitting reforms, such as creating a one-stop ombudsman agency to adjudicate conflicting regulations and exercise real clout among the dozens of agencies with a stake in the permitting process, billions could be shaved off that total. Similarly, CEQA reforms could shave additional billions off the total. How much could be saved?

The Sorek desalination plant, commissioned in Israel in 2015, cost $500 million to build and desalinates 185,000 acre feet of water per year. Compared to Carlsbad, Sorek came online for an astonishing one-sixth the capital cost per unit of capacity. While there’s undoubtedly more to this story, it is also undeniable that other developed nations are able to deploy large scale desalination plants at far lower costs than here in California.

Financing costs for water recycling, while still staggering, are (at least in California) not comparable to those for desalination. The GWRS water recycling plant in Orange County was built at a capital cost of $905 million – $481 million was the initial cost, the first expansion cost $142 million, and the final expansion cost $282 million. This equates to a capital cost of $7,300 per acre foot of annual yield. If that price were to apply for new facilities to be constructed elsewhere in the southland, one million acre feet of recycling capacity could be built for $7.3 billion. Until there is direct potable reuse, however, it would be necessary to add to that cost the expense of either constructing storage reservoirs, or decontaminating aquifers for underground storage.

It’s anybody’s guess, but with reasonable reforms to contain costs, and taking into account additional investments in aquifer mitigation, a budget to make California’s Southland water independent might look like this:

  • 1.0 million acre feet from water recycling – $7.5 billion
  • 1.0 million acre feet from desalination – $15.0 billion
  • 0.5 million acre feet from runoff capture and aquifer mitigation – $7.5 billion

Total – $30 billion.
How much again is that bullet train? Water abundance in California vs. high speed rail

While runoff capture, water recycling, and desalination have the potential to make Southern California’s coastal megapolis water independent, it will take extraordinary political will and innovative financing to make it happen. The first step is for California’s voters and policymakers alike to recognize that conservation is not enough, that water supplies must be increased. Once the political will is established, it will be necessary to streamline the regulatory process, so cities, water agencies, and private contractors can pursue supply oriented solutions, at realistic prices, with a reasonable certainty that their applications will be approved.

*   *   *

How Much California Water Bond Money is for Storage?

Californians have approved two water bonds in recent years, with another facing voters this November. In 2014 voters approved Prop. 1, allocating $7.1 billion for water projects. This June, voters approved Prop. 68, allocating another $4.0 billion for water projects. And this November, voters are being asked to approve Prop. 3, allocating another $8.9 billion for water projects. This totals $20.0 billion in just four years. But how much of that $20.0 billion is to be invested in water infrastructure and water storage?

Summaries of how these funds are spent, or will be spent, can be found on Ballotpedia for Prop. 1, 2014, Prop. 68, 2018 (June), and the upcoming Prop. 3, 2018 (November). Reviewing the line items for each of these bonds and compiling them into five categories is necessarily subjective. There are several line items that don’t fit into a single category. But overall, the following chart offers a useful view of where the money has gone, or where it is proposed to go. To review the assumptions made, the Excel worksheet used to compile this data can be downloaded here. The five categories are (1) Habitat Restoration, (2) Water Infrastructure, (3) Park Maintenance, (4) Reservoir Storage, and (5) Other Supply/Storage.

California Water Bonds, 2014-2018  –  Use of Funds
($=millions)

The Case for More Water Storage

It isn’t hard to endorse the projects funded by these water bonds. If you review the line items, there is a case for all of them. This November, voters will have a chance to approve $200 million to restore Salton Sea habitat, a sum that joins the $200 million of Salton Sea habitat restoration approved by voters in June 2018 in Prop. 68. This November, voters will have a chance to approve $150 million to turn the Los Angeles River back into a river, instead of the concrete culvert that was completely paved over between 1938 and 1960.

Who would be against projects like this? But Californians are heavy water consumers in a relatively arid state. Habitat restoration and park maintenance spending must be balanced against spending for water infrastructure. And conservation mandates must be balanced with investments in infrastructure that increase the overall supply of water. Here’s how Californians are currently managing their water:

Total Water Supply and Usage in California

As can be seen on the above table, residential water consumption represents less than 6% of California’s total water diversions. Indoor water consumption, only about half of that. Yet conservation measures imposed on California’s households are somehow expected to enable more water to be returned to the environment. Even with farmers, where conservation measures have the potential to yield far more savings, putting more irrigated land into agricultural production easily offsets those savings.

Not only does conservation fail to return sufficient water to the environment for habitat maintenance, but there is a downside in terms of system resiliency. During the last drought, when households were asked to reduce water consumption by 20%, it wasn’t an impossible request to fulfill. But as these reductions in consumption become permanent, far less flexibility remains.

California’s climate has always endured periods of drought, sometimes lasting several years. Meanwhile, the population continues to increase, farming production continues to rise, and we have higher expectations than ever in terms of maintaining and restoring healthy ecosystems throughout the state. We cannot merely conserve water. We need to also increase supplies of water. Ideally, by several million acre feet per year.

How Much California Water Bond Money is for Surface Storage?

Prop. 1, approved by voters in 2014, was called the “Water Quality, Supply, and Infrastructure Improvement Act of 2014.” It was marketed as necessary to increase water storage in order to protect Californians against droughts, and was overwhelmingly approved by over 67% of voters. But only about one-third of the money actually went to water storage, and it took nearly four years before any of those funds were allocated to specific storage projects. It was only this month, July 2018, that the California Water Commission awarded grants under their “Water Storage Investment Program.”

A review of these grants indicates that only two of them allocate funds to construct large new reservoirs. The proposed Temperance Flat Reservoir will add 1.2 million acre feet of storage. Situated south of the delta, it will be constructed on the San Joaquin River above a much smaller existing dam. It is estimated to cost $2.7 billion, and the California Water Commission awarded $171 million, only about 6% of the total required funds.

The proposed Sites Reservoir is situated north of the delta, west of the Sacramento river. It is an offstream reservoir, meaning that it will be filled using excess storm runoff pumped out of the Sacramento river during the rainy season. It is designed to store up to 1.8 million acre feet of water and is estimated to cost $5.2 billion to construct. The California Water Commission awarded $816 million, a large sum, but only about 16% of the total required funds.

Two other surface storage projects were approved, expansion of the existing Los Vaqueros and Pacheco reservoirs. Both of these reservoirs serve water consumers in the San Francisco Bay Area, both are supplied water via the California Aqueduct, and both expansion projects are estimated to cost not quite a billion dollars – $795 million for Los Vaqueros and $969 million for Pacheco. The California water commission awarded Los Vaqueros $459 million, and they awarded Pacheco $484 million.

When you consider surface storage, the total capacity of a reservoir is a critical variable, but in many ways more significant is the annual “yield.” This is the amount of water that on average, over decades, the reservoir is planned to deliver to water consumers in normal years. While the Los Vaqueros and Pacheco reservoir expansions combined will add roughly 250,000 acre feet of storage capacity, most of this added capacity is to save for drought years. Los Vaqueros may actually yield up to 35,000 acre feet per year in normal years; Pacheco may yield around 20,000 acre feet per year in normal years.

With respect to annual yields, the case for the much larger Sites and Temperance Flat reservoirs becomes more compelling. The Temperance Flat Reservoir is projected to yield 250,000 acre feet of water in normal years, the Sites Reservoir, a massive 500,000 acre feet. To put this in perspective, 750,000 acre feet represents 20% of ALL residential water consumption in California, or, put another way, each year these reservoirs will yield a quantity of water equivalent to 100% of the reductions achieved via conservation measures imposed on California’s residents during the drought. But will they ever get built?

According to spokespersons for the Sites and Temperance Flats projects, some federal funding is expected, but most of the funding will be from agricultural and urban water districts who will purchase the water (as well as the right to store surplus water in the new reservoir) as soon as its available. The projects still require congressional approval, and then will face a multi-year gauntlet of permit processes and the inevitable litigation. If all goes well, however, both of them could be built and delivering water by 2030.

How Else is Water Bond Money Being Used to Increase Water Supply?

All three of the recent water bonds had some money allocated to invest in water supply. Prop. 1 in 2014, in addition to investing $1.9 billion in surface water storage, allocated $1.4 billion to other projects intended to increase water supply. The projects they approved are either intended to store water in underground aquifers, or fund advanced water treatment and recycling technologies which have the practical effect of increasing water supply. While it isn’t clear from these groundwater storage proposals how much water they would then release in normal years, it appears that cumulatively the projects intend to eventually store as much as 1.0 million acre feet in underground aquifers.

At a combined cost total cost of under one billion, the aquifer storage projects just approved appear to be more cost effective than surface storage. It is also a critical priority to recharge California’s aquifers which have been drawn down significantly over the past several years, especially during the recent drought.

Prop. 68, the “Parks, Environment, and Water Bond” passed earlier this year, while mostly allocating its $4.0 billion to other projects, did allocate $290 million to “groundwater investments, including groundwater recharge with surface water, stormwater, and recycled water and projects to prevent contamination of groundwater sources of drinking water.”

The upcoming Prop. 3, the $8.9 billion “Water Infrastructure and Watershed Conservation Bond Initiative” that will appear on the November 2018 ballot, invests another $350 million to maintain existing, mostly small urban reservoirs, along with $200 million to complete repairs on the Oroville Dam. Prop. 3 also includes $1.6 billion to otherwise increase water storage and supply, including $400 million for wastewater recycling and $400 million for desalination of brackish groundwater.

It is important to emphasize again that all of the funds allocated in these three water bonds are paying for what are arguably worthwhile, if not critical projects. $6.3 billion for habitat restoration, $6.2 billion for water infrastructure, $1.6 billion to maintain our parks. But despite the worth of these other projects, Californians urgently need to increase their annual supply of water to ensure ecosystem health, irrigate crops, and supply urban consumers. And to address that need, out of $20 billion in water bonds passed or proposed between 2014 and this November, only $5.8 billion, less than one-third, is being used to increase water supplies.

What Other Ways Could Water Bond Money Be Used to Increase Water Supply?

Clearly the most important region to increase water supply is Southern California. Two thirds of all Californians live south of the Sacramento River Delta, while most of the rain falls on in Northern California. One way to increase California’s supply of fresh water is to build desalination plants. This technology is already in widespread use throughout the world, deployed at massive scale in Singapore, Israel, Saudi Arabia, Australia, and elsewhere. One of the newest plants worldwide, the Sorek plant in Israel, cost $500 million to build and desalinates 120,000 acre feet of water per year.

Theoretically – because capital costs in California are far higher than in most of the rest of the developed world – desalination offers a cost-effective solution to water scarcity. Uniquely, desalination creates new water, not dependent on rainfall, not requiring storage for drought years, not requiring redirecting of water from other uses. Imagine if Californians invested in desalination plants along the entire Southern California Coast. Eight desalination plants the same size as the Sorek plant would cost $4.0 billion to build if constructed for the same cost as the one in Israel cost. They could desalinate 1.0 million acre feet per year.

The energy costs for desalination have come down in recent years. Modern plants, using 16″ diameter reverse osmosis filtration tubes, only require 5 kWh per cubic meter of desalinated water. This means it would only require a 700 megawatt power plant to provide sufficient energy to desalinate 1.0 million acre feet per year. Currently it takes about 300 megawatts for the Edmonston Pumping Plant to lift one million acre feet of water from the California aqueduct 1,926 ft (587 m) over the Tehachapi Mountains into the Los Angeles basin. And that’s just the biggest lift, the California aqueduct uses several pumping stations to transport water from north to south. So the net energy costs to desalinate water on location vs transporting it hundreds of miles are not that far apart.

The entire net urban water consumption on California’s “South Coast” (this includes all of Los Angeles and Orange County – over 13 million people) is 3.5 million acre feet. It is conceivable that desalination plants producing 1.0 million acre feet of new water each year, combined with comprehensive sewage reuse and natural runoff harvesting could render the most populous region in California water independent.

Why is Infrastructure so Expensive in California?

The Carlsbad desalination plant in San Diego cost $925 million to build, and it has a capacity of 56,000 acre feet per year. That is a capital cost per acre foot of annual yield of $16,500. How is it that the Sorek desalination plant in Israel cost $500 million to build and has a capacity of 120,000 acre feet per year – a capital cost per acre foot of annual yield of only $4,100? Why did it cost four times as much to build the Carlsbad desalination plant?

This is the prevailing question when evaluating infrastructure investment in California. Why does everything cost so much more? The Sites reservoir is projected to cost $5.2 billion. An off-stream reservoir of equal size, the San Luis Reservoir, was constructed in California in the 1960s at a total cost, in 2018 dollars, of $2.3 billion. That all-in cost includes not just the dam, but also includes pumping stations, the forebay, the intertie to the California Aqueduct, and conveyances to get some of the water over the Diablo Range into the Santa Clara Valley. All of these costs (in today’s dollars) for the San Luis Reservoir, compared to the proposed Sites Reservoir, cost less than half as much. Why?

It’s easy to become enthusiastic about virtually any project that will increase our resiliency to disasters and droughts, improve our quality of life, steward our ecosystems, and hopefully create abundance of vital resources such as water. But when considering the need for these various projects, it is equally important to ask why they cost so much more here in California, and to explore ways to bring costs back down to national and international norms. We could do so much more with what we have to spend.

Edward Ring co-founded the California Policy Center and served as its first president.

California’s Transportation Future, Part Four – The Common Road

With light rail, high speed rail, and possibly passenger drones and hyperloop pods just around the corner, it’s easy to forget that the most versatile mode of transportation remains the common road. Able to accommodate anything with wheels, from bicycles and wheelchairs to articulated buses and 80 ton trucks, and ranging from dirt tracks to super highways, roads still deliver the vast majority of passenger miles.

As vehicles continue to evolve, roads will need to evolve apace. Roads of the future will need to be able to accommodate high speed autonomous vehicles. They will also need to be smart, interacting with individual vehicles to safely enable higher traffic densities at higher speeds. But can California build roads competitively? How expensive are road construction and maintenance costs in California compared with other states in the U.S.? How can California make the most efficient use of its public transportation funds?

PHYSICAL VARIABLES AFFECTING CONSTRUCTION COSTS

The Federal Highway Administration maintains a cost/benefit model called “HERS” (Highway Economic Requirements System) which they use to evaluate highway construction and highway improvement projects. One of the products of HERS is the FHWA’s most recent summary of road construction costs, updated in 2015. Its findings reveal both the complexity facing any cost analysis as well as the wide range of results for similar projects.

For example, on the FHWA website’s HERS summary page, Exhibit A-1 “Typical Costs per Lane Mile Assumed in HERS by Type of Improvement” data is presented in nine columns, each representing a typical project category for which the FHWA analyzes costs. They are: “Reconstruct and Widen Lane,” “Reconstruct Existing Lane,” “Resurface and Widen Lane,” “Resurface Existing Lane,” “Improve Shoulder,” “Add Lane, Normal Cost,” “Add Lane, Equivalent High Cost,” New Alignment, Normal,” “New Alignment, High.”

The FHWA then break their results in each of the nine project categories into two broad groups; rural and urban. Within each of those two groups, they offer the subgroups; “Interstate,” “Other Principal Arterial” (these two are combined in the “Rural” group), “Minor Arterial,” and “Major Collector.” This creates seven cost groups, each of which are then further split. For “Rural” categories, they split into “Flat,” “Rolling,” and “Mountainous.” For “Urban” categories, they split into “Small Urban,” “Small Urbanized,” “Large Urbanized,” and “Major Urbanized.”

To make a long story short, and to state the obvious, “cost per lane mile” is never one number. The FHWA’s HERS table, which itself is a reductive, arguably arbitrary summary, there are 252 distinct cost per lane mile estimates, 24 per project category. And within these nine categories, the range of costs is dramatic.

According to the HERS analysis, adding a new lane to an interstate on flat terrain in a rural area costs $2.7 million per lane mile. To do the same thing in a major urbanized area costs $62.4 million per lane mile, more than twenty times as much. Even minor projects display wide ranges in cost. Resurfacing an existing lane of a principal arterial in a flat, rural area costs $279,000 per lane mile. To do the same in a major urbanized area costs $825,000 per lane mile, three times as much.

The fact that topography, existing usage and population density affect road construction costs isn’t news. But the wide variation in costs that result from these physical variables compounds the other major factor affecting road construction costs, which is the political and economic environment of the states where projects occur. As will be seen, the FHWA compiles state by state data on road construction. This data, however, is apparently not sufficient to allow the FHWA to produce a HERS summary showing costs per lane mile by state.

EXAMINING FEDERAL DATA ON ROAD EXPENDITURES BY STATE

The FHWA Office of Highway Policy Administration does issue a highway statistics report, updated annually, that provides valuable per state data on highway mileage and transportation budgets. Their 2016 report is available but incomplete (still missing key tables such as “Disbursements by States for Highways”) so the 2015 report is still the most current. These tables are uniformly formatted and downloadable.

California’s Spending per Mile vs. Condition of Roads

An excellent analysis of FHWA data is produced every year by the Reason Foundation. Earlier this year they released “23rd Annual Highway Report,”ranking each state’s highway system in 11 categories, including highway spending, pavement and bridge conditions, traffic congestion, and fatality rates.” Highlights from this study can offer insights into how efficiently California is spending its highway dollars compared to other states through using the following logic: How does California rank in terms of how much it spends per mile, compared to how California ranks in terms of the condition of its roads.

Overall California is ranked 43 among the 50 states “Total Disbursements per mile.” California is ranked 41 in “Capital & Bridge Disbursements per mile,” 47 in “Maintenance Disbursements per mile, and 46 in “Administrative Disbursements per mile.” In terms of road condition, California is ranked 33 in “Rural Interstate Pavement Condition,” 45 in “Urban Interstate Pavement Condition,” and 46 in “Rural Arterial Pavement Condition.”

There’s not too much you can conclude from that in terms of efficient use of funds. Among the 50 states, California appears to be at or near the bottom 10% in spending per mile of road, and also in pavement condition.

In terms of cost-efficiency, among all states, this data suggests California is in the middle of the pack.

How Centralized Are California’s Road and Highway Agencies?

Within the FHWA data an interesting finding is the great variation between states in road mileage under state administration vs. road mileage under other administration – mostly cities and counties, but also federal. Only a few states, mostly the larger western states, have any significant mileage administered directly by the federal government – Alaska 14%, Arizona 22%, Idaho 16%, Montana 16%, New Mexico 16%, Oregon 28% and Washington 11%, and Wyoming 13%. Most all other states have low single digit percentages of roads administered by the federal government. The national average is 3%. California, only 6%.

State administration of road construction is higher, but still relatively low. The national average is 19% of road mileage administered by state agencies. California’s is significantly lower than average, at only 8%. Altogether, nationally, 78% of road mileage is administered by local agencies, mostly cities and counties. In California, 87% of road mileage is administered locally.

Before inferring too much from this fact, that road construction and administration is overwhelmingly ran by local agencies, FHWA funding data is useful. The data shows that total funding for roads in California in 2015 was $19.0 billion. Of that, 44% ($8.3 billion) was for “Capital Outlay,” which refers to new roads, new lanes on existing roads, new bridges, and bridge upgrades. The national average is 47% of all road spending on capital.

More to the point, the CalTrans budget in 2015 was $10.5 billion. According to the California Office of Legislative Analyst, that “includes $3.9 billion for capital outlay, $2 billion for local assistance, 1.8 billion for highway maintenance and operations, and $1.7 billion to provide the support necessary to deliver capital highway projects. How much of that was reported to the FHWA as part of the total $8.3 billion spent on capital? Certainly the $3.9 billion “for capital outlay.” Probably the “$1.7 billion to provide the support necessary to deliver capital highway projects”? What about the $2.0 billion of local assistance? For capital projects, it appears that between $5.6 billion and $7.6 billion of the total spending of $8.3 billion came from CalTrans.

The State of California’s role in total spending on road transportation is also reflected in the budget allocations in that year for the California Highway Patrol, $2.4 billion, which is included in the FHWA’s total for California, under “Law Enforcement” ($3.4 billion). It is possible, if not likely, that the state’s $1.1 billion for the Dept. of Motor Vehicles is included either in the Law Enforcement or Administration categories in the FHWA data, or allocated between them. Finally, the finance charges – interest payments and debt retirement totaling $1.5 billion – are not coming out of the budgets for the state’s transportation agencies, but some percentage of that total is paid by the state. Altogether it is likely that the State of California directly funded about $12 billion, roughly 63% of the $19 billion spent on road construction and administration in 2015.

Based on funding data, state agencies clearly play a central role in constructing and maintaining California’s roads.

California’s Spending per Lane Mile vs. Percentage of Lane Miles in Urban Areas

An interesting alternative way to get at how efficiently California uses its public transportation funds is to evaluate based on the expanded variables of total lane-miles instead of state administered road mileage, and total spending on roads by all public transportation agencies instead of just Caltrans. The rationale for using lane-miles relies on the assumption that it is more costly to build a mile of six lane highway (three lanes in each direction) than a mile of two lane road, meaning that lane miles provides a more meaningful denominator, if the numerator is total public spending on roads. The rationale for examining spending by all public transportation agencies relies on the assumption that many, if not most of the political and economic factors that govern road construction costs in California are common throughout the state, having the same effect on construction costs regardless of the funding source.

Using FHWA data on lane miles and total spending by state to calculate spending per lane-mile, California was found to average $43,999 in total spending per lane-mile. This ranks California 42 among all states. The national average is $25,474 in transportation spending per lane-mile. Put another way, for every dollar that, on average, is spent to build and maintain a lane-mile in the nation as a whole, California spends $1.73. This suggests that California is not spending its transportation funds nearly as efficiently as the most other states, but without considering other variables this is a misleading statistic.

One of the largest factors determining cost per lane-mile is urbanization. This is clearly evident in the previously mentioned FHWA website’s HERS summary page, Exhibit A-1 “Typical Costs per Lane Mile Assumed in HERS by Type of Improvement,” where costs per lane-mile are uniformly higher in urban areas, and in some cases far higher. As noted earlier, “According to the HERS analysis, adding a new lane to an interstate on flat terrain in a rural area costs $2.7 million per lane mile. To do the same thing in a major urbanized area costs $62.4 million per lane mile, more than twenty times as much.”

The idea that road construction costs more in urban areas can be attributed to several interrelated factors: Land values are typically greater in densely populated areas. Construction challenges are greater in urban areas where it is more likely that existing structures may have to be acquired and demolished to permit road construction or widening. Labor costs are typically higher in urban areas. Urbanized regions also are likely to have more local restrictions on development, leading to more costly permitting processes and higher fees. There are other key factors influencing road construction costs – for example, climate and topography – but urbanization is easily quantifiable and likely the most significant of them.

For this reason, the following chart includes not only spending per lane-mile by state, but also includes the percentage of lane-miles, by state, that are in urban areas. Here, California distinguishes itself as one of the most urbanized states, having 59% of its lane-miles within urban areas. The national average, by contrast, is almost half that; only 31% of the nation’s lane miles are located in urban areas. Tracking these two rankings, spending per lane-mile and percentage of urban lane miles, permits an illuminating comparison. If one assumes there is a correlation between cost per lane mile and percentage of lane miles in urban areas, then how a state ranks in one should be similar to the how it ranks in the other.

Six states conform exactly to this assumption. Utah, for example, is the 24th most expensive state to construct roads per lane-mile, and it has the 24th most rural percentage of roads. Similarly, Illinois has a $/mile rank of 34, and it has a rural road % rank of 34. Texas, Pennsylvania, New Jersey, and the District of Colombia all have $/mile rankings exactly equal to their rural road % ranking. Five more states have a deviation between their $/mile rank and their rural road % rank of only one. California’s is only two – it is ranked 42 in its cost per lane mile, making it quite expensive relative to most states, but it is ranked 44th in its percentage of lane-miles in rural areas, meaning it is one of the most urbanized states.

The final set of columns on the chart, on the right, show a score for each state based on the rural road percent ranking less the $/mile ranking. If the score is negative, that means the state spending on lane miles ranks better (less per mile) than its rank based on its percentage of rural lane-miles. In other words if the score is negative, that means the state is spending less per lane mile than one might expect based on their level of urbanization, and if the score is positive, the state is spending more per lane mile than one might expect based on their level of urbanization.

Once again, California is in the middle of the pack.

Spending per Lane-Mile by State; Percentage of Urban Lane-Miles by State
(Source: Federal Highway Administration, 2015)

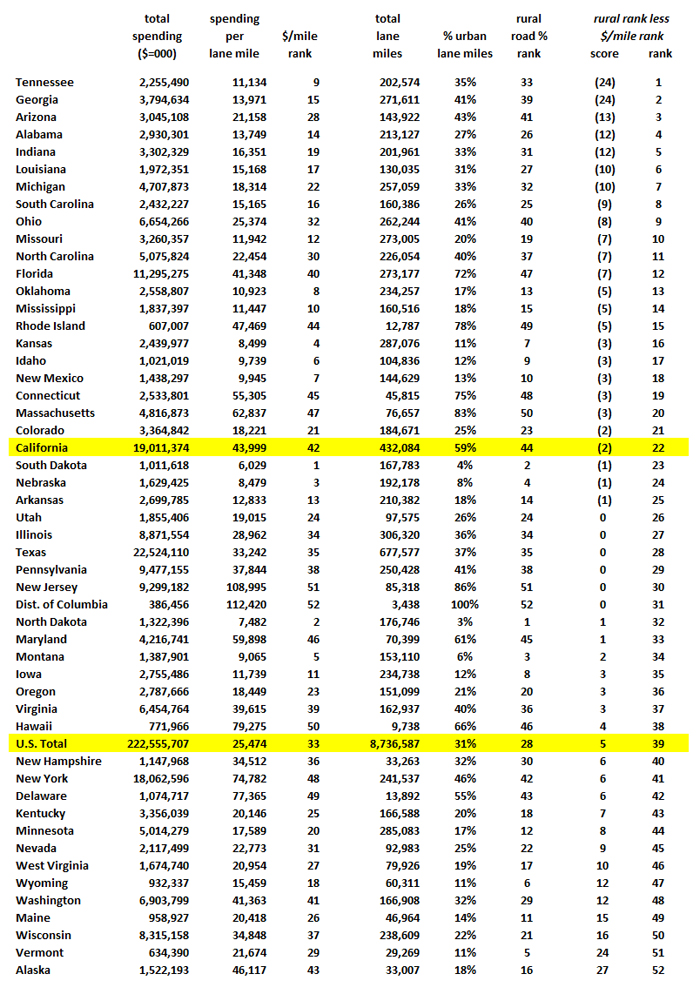
If one assigns any credence to these rankings, it presents interesting questions. Why is it that states like Georgia and Tennessee, which are relatively urbanized, are among the top performers in terms of being able to cost-effectively construct and maintain their roads? In the case of Tennessee, it isn’t as if they’ve neglected their roads, they are in the top ten in all three FHWA measurements of pavement condition. Georgia’s scores on pavement condition put them in the middle among states.

In some of the poorly ranked states, topography and climate may be factors. Alaska, the one of the least urbanized states nonetheless is one of the most expensive states to build and maintain roads, which should come as no surprise. Most of the states with low scores have harsh climates.

A final note regarding California – while it shows a high correlation between its cost per lane-mile and its level of urbanization, it does not score well in the three pavement condition indexes; 33 out of 50 for rural interstates, 45 out of 50 for urban interstates, and 46 out of 50 for rural arterial roads.

California can do better.

OBSERVATIONS AND RECOMMENDATIONS

Federal data indicates that while California scores poorly compared to other states in terms of road conditions, California also spends less than other states in terms of expenditures per lane mile. Considered in isolation, those two facts only suggest that California is using its transportation funds no more and no less efficiently than the average state. While federal data also indicates that California, overall, spends nearly twice as much per lane-mile as the national average, California is also more heavily urbanized, and normalizing for that reveals again that California is being roughly as cost effective in its use of transportation dollars as the average state.

When factoring in the condition of California’s roads, however, which are near the bottom in pavement condition indexes, California is not using its transportation dollars as well as it could.

Anecdotally, literally everyone surveyed – and we talked with representatives from dozens of agencies, research firms, and transportation agencies – agreed that per mile road construction costs are higher in California than most other states. But the federal data we had access to does not offer documentary proof of that, and Caltrans, despite numerous attempts, could not produce data on per mile construction costs that could be compared to national averages.

The lack of transparency, the complexity, and the subjective nature of any resulting analysis makes it difficult to assert with any certainty where California falls relative to other states – it is either somewhat below average, or far below average, but making that call requires a level of evidence and clarity that is simply not available. Ultimately it does not matter where California falls in that continuum, because regardless of how efficiently California spends their public transportation funds per lane mile of new or upgraded roads, there are ways to improve. The following recommendations were heard repeatedly, from contractors, trade associations, and researchers familiar with the topic. The first two in particular:

(1) Reform CEQA

CEQA, or the California Environmental Quality Act, is a “statute that requires state and local agencies to identify the significant environmental impacts of their actions and to avoid or mitigate those impacts, if feasible.” While the intent behind CEQA is entirely justifiable, in practice it has added time and expense to infrastructure projects in California, often with little if any actual environmental benefit. An excellent summary of how to reform CEQA appeared in the Los Angeles Times in Sept. 2017, written by Byron De Arakal, vice chairman of the Costa Mesa Planning Commission. It mirrors other summaries offered by other informed advocates for reform and can be summarized as follows:

  • End duplicative lawsuits: Put an end to the interminable, costly legal process by disallowing serial, duplicative lawsuits challenging projects that have completed the CEQA process, have been previously litigated and have fulfilled any mitigation orders.
  • Full disclosure of identity of litigants: Require all entities that file CEQA lawsuits to fully disclose their identities and their environmental or, increasingly, non-environmental interest.
  • Outlaw legal delaying tactics: California law already sets goals of wrapping up CEQA lawsuits — including appeals — in nine months, but other court rules still leave room for procedural gamesmanship that push CEQA proceedings past a year and beyond. Without harming the ability of all sides to prepare their cases, those delaying tactics could be outlawed.
  • Prohibit rulings that stop entire project on single issue: Judges can currently toss out an entire project based on a few deficiencies in environmental impact report. Restraints can be added to the law to make “fix-it ticket” remedies the norm, not the exception.
  • Loser pays legal fees: Currently, the losing party in most California civil actions pays the tab for court costs and attorney’s fees, but that’s not always the case with CEQA lawsuits. Those who bring CEQA actions shouldn’t be allowed to skip out of court if they lose without having to pick up the tab of the prevailing party.

(2) Restructure Caltrans

Caltrans currently outsources only about 10% of its work. Despite repeated attempts to legislate changes that would require Caltrans to use contractors to lower costs, no action has been taken. In a report prepared in 2015 by state senator Moorlach, the failure of California’s legislature to implement reforms is described: “In previous administrations, Governor Schwarzenegger pushed for an 89/11 ratio and could not achieve it. Even Governor Brown proposed a reduced ratio that was rejected by the Legislature.”

By maintaining permanent engineering staff instead of contracting, whenever projects are concluded these engineers are often idle until another project comes along. The Legislative Analyst’s Office in 2015 reported that there were 3,500 of these positions created for programs that have expired, requiring an extra $500 million each year.

The advantage of contracting out engineering work isn’t merely based on more efficiently allocating personnel to projects to avoid down time. When Caltrans does the designing, then puts the project out for bids, the contracting companies have to conduct redundant design analysis in order to prepare their bids. This also contributes to increased costs which are passed on to the taxpayer as well as extra time. In moving to a system where Caltrans just specifies the project goals and lets the contractors prepare competitive bids based on in-house designs, the taxpayer saves time and money. Ways to restructure Caltrans might include:

  • Immediately increase the ratio of contracted work from 10% to 20%.
  • Permit the headcount of in-house engineers at Caltrans to reduce through retirements and voluntary departures, systematically increasing the ratio of contracted work as the number of Caltrans in-house engineers decreases. Set a goal of at least 50% contracted work within five years.
  • Abolish the current requirement that the state legislature has to approve any projects that are contracted by Caltrans instead of designed in-house.

(3) Decentralize and Innovate

On the FAQ page for Elon Musk’s Boring Company, the following innovations are proposed to lower the cost of tunneling by a factor of between 4 and 10: (1) Triple the power output of the tunnel boring machine’s cutting unit, (2) Continuously tunnel instead of alternating between boring and installing supporting walls, (3) Automate the tunnel boring machine, eliminating most human operators, (4) Go electric, and (5) Engage in tunneling R&D. More generally, on that FAQ page the following provocative assertion is made: “the construction industry is one of the only sectors in our economy that has not improved its productivity in the last 50 years.”

How can California use public transportation dollars to nurture innovation that will deliver more people to more places, faster, safely, for less money? One way would be to nurture competition by nearly eliminating Caltrans. Why should one state agency control nearly two-thirds of the funds for road construction and maintenance in California? Why not reduce Caltrans to a couple dozen administrators to handle federal regulations and direct federal funds and move all road work, expansion and maintenance to the counties? The counties can conform to a general state plan, but there’s no reason to have a state bureaucracy any more when the counties can be challenged to be more efficient, effective and non-duplicative in their work.

Imagine the innovation that might come out of Santa Clara County, where stretches of roadway could be immediately prioritized to add smart lanes where autonomous cars – including mini-buses and share cars – can operate safely at much higher densities and speeds. Imagine the innovation that might come out of Los Angeles County, where entire transit corridors could have congestion greatly relieved because thousands of cars are being swiftly and safely transported from point to point in underground tunnels. Imagine the innovation that might come out of San Francisco, where congestion pricing completely eliminates their chronic gridlock, or out of Orange County, where private investors team up with public agencies to use roboticized equipment to perform heavy road construction at a fraction of the cost for conventional processes?

Why not decentralize transportation management in California and turn the counties into laboratories of innovation?

(4) Expand Into the Vastness of California

It is an accident of history that California is so densely urbanized. Most metropolitan regions on the east coast, developed gradually over three centuries or more, have thousands of square miles of spacious suburbs, and tens of thousands of even more spacious expanses of moderately settled lands on the edges of remaining wilderness areas. California, in stark contrast, has nearly 18 million people residing in greater Los Angeles and over 7 million people residing in the greater San Francisco Bay Area. If you add residents of the San Diego region and Sacramento regions, you account for 32 million out of a population of 39 million. And yet all of California’s urban areas, the most densely urbanized in the nation, only constitute five percent of its 163,696 square miles! The math is compelling – you could settle ten million people in four person households on half-acre lots and it would only consume 1,953 miles. Double that for roads, parks, commercial and industrial space, and you are still only talking about urbanizing another 2.4% of California’s land. The idea that we cannot do this is preposterous.

The cost of infrastructure, roads in particular, is much higher in urban areas. So why not expand along the nearly empty Interstate 5 corridor, creating new towns and cities that are spacious and zoned to never become congested? Why not upgrade I-5 to accommodate high speed smart vehicles that provide nearly the speed of high-speed rail, while preserving the point-to-point convenience that only a car can offer? Why not expand along the entire fringe of California’s great Central Valley, where currently thousands of square miles of cattle rangeland are being taken out of production anyway? Why not build more roads on this raw land, bringing down the cost both for roads and the homes that will be built around them?

(5) Change the Conventional Wisdom

California’s policymakers have adhered increasingly to a philosophy of limits. Urban containment. Densification. Less energy use. Less water consumption. Fewer cars and more mass transit. But it isn’t working. It isn’t working because California has the highest cost of living in the nation. Using less energy and water never rewards consumers, because the water and energy never were the primary cost within their utility bills – the cost of the infrastructure and overhead was the primary cost, and those costs only go up with renewables. Cramming home construction into limited areas not only destroys the ambiance of existing neighborhoods, but simply cannot increase the supply of homes enough to lower the cost.

There is a completely different approach that would cost less and improve the quality of life for all Californians. Without abandoning but merely scaling back the ambition of new conservation and efficiency mandates, free up funds to build safe, generation III+ advanced nuclear reactors. At the same time, construct desalination plants on the Southern California coast, enough of them to supply the entire Los Angeles basin with fresh water. Instead of mandating water rationing for households, put the money that would have been necessary to retrofit all those homes into new ways to reuse water and capture storm runoff.

Paying for all of this wouldn’t have to rely exclusively on public funds. Private sector investment could fund most of the energy and water infrastructure. Water supplies could be even more easily balanced by permitting water markets where farmers could sell their water allotments without losing their grandfathered water rights. If the permit process and mandated design requirements were reduced, builders could carpet former cattle ranches with new homes, sold for a profit at affordable prices.

CONCLUSION

This is the final segment of a four part excursion into California’s transportation future. In each section the same themes emerged: It isn’t just what gets built to serve future Californians, it’s how cost effectively the money is spent. Innovation and regulatory reform – CEQA in particular, but also repealing SB 375AB 32, and related anti-growth legislation – together have the potential to lower the cost of infrastructure, transportation in particular, by at least 50%.

California’s current policies have stifled innovation and created artificial scarcity of literally every primary necessity – housing, energy, water and transportation. Each year, to comply with legislative mandates, California’s taxpayers are turning over billions of dollars to attorneys, consultants and bureaucrats, instead of paying engineers and heavy equipment operators to actually build things.

The innovation that persists despite California’s unwelcoming policy environment is inspiring. Right here are the pioneering companies that will deliver flying cars, commercial access to outer space, breakthrough modes of transportation such as hyperloop and urban tunnels. Right here are the companies that will deliver self-driving cars, cars on demand, high-speed smart cars. These things will happen within a time frame that is, by the standards of human history, breathtakingly short. And with the right assortment of pro-growth policies in place, more of them will happen right here.

California’s transportation future cannot be predicted with any certainty. If the past few decades have taught us anything, it is that innovation routinely delivers products and solutions that nobody could have possibly imagined. But it is a reasonably safe bet that the common road is the most useful mode of transportation infrastructure for which public policy can risk public funds. A flat surface where wheeled conveyances of every conceivable design can all travel from point to point, clean, smart, versatile, sustainable, and fast.

*   *   *

Edward Ring co-founded the California Policy Center in 2010 and served as its first president.

California’s Transportation Future, Part One – The Fatally Flawed Centerpiece

California’s Transportation Future, Part Two – The Hyperloop Option

California’s Transportation Future, Part Three – Next Generation Vehicles

REFERENCES

[1] Federal Highway Administration – Highway Economic Requirements System

[2] Office of Highway Policy Information – Highway Statistics 2015

The FHWA’s annual highway statistics report is actually a series of tables, uniformly formatted and downloadable as Excel files. For this report, the following tables were downloaded and consolidated:

[2-A] Selected measures for identifying peer states

[2-B] Disbursements by States for highways

[2-C] Length by ownership

[2-D] Estimated lane-miles

[2-E] Disbursements by States for State-administered highways

[2-F] Total disbursements for highways, all units of government

[2-G] Estimated lane-miles by functional system

[3] Reason Foundation – 23rd Annual Highway Report

[4] California Office of Legislative Analyst – The 2015-16 Budget: Transportation Proposals

[5] California Office of Legislative Analyst – The 2014-15 Budget: Capital Outlay Support Program Review