Apolitical Government Reform

Not as a libertarians, but as a good government fiscal conservatives, who value government and government programs, how might we respond to charges of right wing radicalism? How might we respond to charges that we are biased against working people, or want to destroy the middle class, or are a tool of the super-rich? If you want to keep good government programs, but want to make government more financially efficient, how to respond to charges of resenting government workers, or wanting to change the deal on government workers, or not appreciating government workers? Focusing on the state and local government entities here in sunny California, here are some thoughts:

(1) Public employees used to take jobs that paid less than private sector jobs. Up until about 20 years ago, the trade-off was clear: Government workers exchanged a lower salary for better benefits, a pension that was better than social security, and job security. This was a fair exchange, and the system worked just fine.

(2) Over the past 20 years, during the economically unsustainable internet bubble followed by the real-estate bubble, public sector unions stirred up envy among public sector employees, prodding them into demanding unsustainable increases to their compensation to match the private sector. Since these bubbles have burst, these unions use their nearly absolute power over California’s state and local politicians to maintain unsustainable levels of public sector employee compensation.

(3) We now have a situation where public employees have, in most cases, better base salaries than in the private sector, and enhanced pension benefits that now are about five times as generous as social security.

(4) It is absurd for anyone to compare public sector workers to the wealthy. Of course wealthy people will have more wealth than middle class workers. Public sector workers need to compare themselves to private sector workers. In California, the private sector worker makes, on average, about half as much in total compensation than the public sector worker. It strains credulity – and is downright arrogant – to suggest this entire differential can be attributed to superior education and skills.

(5) The people who are being denied a chance to experience upward mobility are the private sector small businesspeople who create jobs, and the people who they hire. Entrepreneurs personally carry legal liability and financial risk for their businesses. They work all the time. When the economy strains under the financial enslavement caused by the partnership of Wall Street banks with government debtors, private sector businesses can’t thrive, and their employees make less.

(6) The wealthy are not right-wing or left-wing. There is as much money donated to left wing causes by wealthy individuals as to right wing causes. The distortion in our democracy is not caused by wealthy individuals, who are ideologically diverse and whose contributions benefit both sides of political and economic questions.

(7) It is necessary to make a distinction between wealthy entrepreneurs who create products and services people voluntarily consume and which improve people’s lives, and wealthy bankers and financial middlemen who have used their political influence to overbuild their industry and become a drain on the economic health of America.

(8) The biggest source of funds to Wall Street bankers and financial middlemen, by far, is the deficit spending of governments. When a government issues bonds, the money goes through Wall Street. When a government pension fund expropriates taxpayer’s money, the beneficiaries are Wall Street brokerages.

(9) The agenda of public sector unions is perfectly aligned with the goals of Wall Street banks. Create bigger government payrolls and pay government employees more. Borrow money and raise taxes to accomplish this. Issue interest bearing bonds to cover deficits and transfer tax revenue into pension fund accounts.

While arguing for more efficient government, it is important to explain how government spending impacts the middle class private sector worker who now has to pay half of their income in taxes (sales, property, income, and “hidden taxes” buried in every utility and telecom bill) so that middle class government employees can earn twice what they make, while Wall Street bankers get obscenely rich managing the government debt and government employee pension funds. And while having no bias against the wealthy, it is necessary to make a distinction between wealthy people who have earned their wealth through entrepreneurship, and those who are wealthy because they are part of the Wall Street cabal that enables and profits from the unionized government bias to tax, spend, and borrow.

The Contract on California

California’s state and local government workers, who enjoy pensions that average at least five-times what a social security recipient can hope to receive, love to claim they have a “contract” that makes reducing these pension benefits impossible.

They certainly do have a contract – sort of like the contract an underworld boss might order on a troublesome associate. Except in this example the underworld bosses are the public employee unions, the troublesome associates are the taxpayers, and the “contract” requires the taxpayer to cover public employee pension fund returns. That is, whenever these government worker retirement funds fail to achieve their projected returns, the taxpayer covers the difference with higher taxes. Nice deal for Wall Street brokerages, who get to manage all the money with no risk. Nice deal for California’s state and local government workers, who enjoy retirements that are, on average, five times better than social security. Really, really bad deal for the taxpayer.

Spokespersons for the government unions and the government worker pension funds have long stated that “the market has just been beat up a bit lately,” and “investment professionals assure us there is no cause for concern.” But the sobering truth is starting to emerge, and according to “contract,” taxpayers are going to get hit hard.

On December 20th the CalSTRS CEO, Jack Ehnes, in a rather convoluted acknowledgement on the “Ask Jack” section of CalSTRS website, admitted that funding to CalSTRS would have to increase by $3.8 billion per year for the next 30 years. Here is what he wrote:

“Recent media reports have suggested that to solve the unfunded liability the state will have to increase CalSTRS funding by $3.8 billion a year for 30 years for a total of more than $114 billion.

Although this is an accurate statement based on current projections, achieving adequate funding can occur several ways that would be phased in over time. The CalSTRS $56 billion funding shortfall can be managed, but it will require gradual and predictable increases in contributions.”

Despite the supposedly reassuring phrase “achieving adequate funding can occur several ways that would be phased in over time,” the fact that even the CalSTRS CEO is himself acknowledging this degree of funding shortfall should belie any thoughts that the number is overstated.

Putting aside for the moment the probability that this $3.8 billion per year is nowhere near the actual additional amount that will be necessary to adequately fund CalSTRS, how much does this latest salvo – pursuant to the contract on California taxpayers – cost per household?

First remember that of 12 million households in California, 47% of them pay no taxes. Also remember that at least another 10% of these households have a state or local government worker living in them. This means that 57% of California’s households are exempt from the contract on California, leaving 43%, or 5.2 million households to cover these new payments.

Second, remember that similar shortfalls exist within all government worker pension funds in California, and CalSTRS only covers teachers, which at most only comprise about 40% of California’s state and local government workforce. This means the $3.8 billion per year CalSTRS shortfall, applied to all state and local government worker pension funds, would expand to $9.5 billion per year.

Anyone who thinks CalPERS or the LA County pension fund, or any other local government worker pension funds in California are in any better financial shape than CalSTRS is welcome to dismiss this logic. Otherwise, according to their own spokespersons, we now are looking for another $9.5 billion per year of additional taxes to keep our unionized government worker pension funds in California solvent.

This equates to nearly $2,000 per year in additional taxes on those 5.2 million households in California who actually pay taxes. That’s just additional taxes, that’s just for pensions, and that is based on what is almost certainly the minimum amount it is going to take to establish financially sound pensions for California’s state and local government workers.

When it comes to pensions, if nothing else, the unionized government worker’s “contract on California” must make everyone who crows about the inviolability of contracts quite proud.

Agroforestry is Regreening the Sahel

The African Sahel is the arid belt of land that forms a buffer between the Sahara desert to the north and the more temperate savannahs to the south. From the coast of Mauritania and Senegal to the west, the Sahel stretches over 3,500 miles to Sudan and Eritrea’s Red Sea coast to the east. Over 500 miles wide, this vast area forms the biggest front line on earth in the relentless battle against desertification.

For decades there has been nothing but bad news. Population increase led to overgrazing and unsustainable harvests of fuelwood. Equally if not more harmful to the Sahel ecosystems were the imposition of western methods of agriculture and forestry, techniques that began under colonial administrations and have been perpetuated over the past 50 years by well-intentioned aid agencies. A fascinating article by Burkhard Bilger in the December 19th issue of The New Yorker, entitled “The Great Oasis (subscription required),” documents a new and hopeful trend in the Sahel that may reverse over a century of environmental decline.

Back in the 19th century and through the first half of the 20th century, French colonial administrators in the Sahel attempted to develop commercial agriculture according to Western techniques that worked well in temperate zones, where sunlight needed to be maximized, but were disastrous in the arid Sahel, where crops responded better if they were beneath a protective tree canopy that attenuated the sunlight. The areas designated as forest were considered state property and were protected, but because farmers were prohibited from allowing trees to grow on in their agricultural fields, they would poach the trees in the protected woodlands because it was their only source of firewood. The new independent governments, backed by NGOs, continued these policies. The practical result was there was no incentive for people to sustainably nurture the forest reserves because they had no legal right to the trees, and since it was a crime to grow trees on farmland, the farmers had no choice but to steal the trees in the forest. And because the trees were necessary to preserve topsoil and filter the sunlight to crops, absent these trees the topsoil blew away and the crops failed.

In “The Great Oasis,” Bilger recounts the experiences of an Australian missionary, Tony Rinaudo, who recognized the destructive impact that well-intentioned aid efforts were having on the Sahel when he was working in northern Niger in the mid 1980’s. Here is Rinaudo’s insight:

“What if things were backward? Every year, the villagers cleared the brush to make room for crops, and planted trees around them. And every year the plantings failed and the brush resprouted from its old rootstocks. What if they just let it grow? What if they cut back only a portion of the native trees, let the rest mature, and planted crops between them?”

For over 25 years this reviving of the traditional practice of farming beneath a canopy of valuable trees that protect the crops by filtering the sunlight, preserving the topsoil from wind, and absorbing runoff has slowly caught on. So much so that just in Niger, over 12 million acres (nearly 20,000 square miles) have been reclaimed.

The photo below shows a satellite image of the Seno Plains in Central Niger, about 400 miles east northeast of the capital Bamako. In this 600 square mile image, the reforested areas can be seen as small nodes of green surrounding the towns. If you zoom closer, using Google Maps, you can see stands of trees spreading literally everywhere on this plain. Twenty five years ago the entire area was denuded of vegetation. The darker area in the upper left of the image is the Dogon Plateau, which is separated from the plains by the cliffs of Bandiagara. Standing on those cliffs today, Bilger writes:

“I could see the thatched roofs of a village tucked among some mango trees below. Beyond them, to the south and west, airy groves of winter thorn and acacia stretched to the horizon. The wind whipped across the plains so steady and sharp that it made my eyes water. But there was no sand in it.”


Another fascinating insight to emerge from Bilger’s report is the hopeful reality that more people did not equate to more environmental stress. Merging traditional agroforestry with access to modern agricultural techniques, the land reclaimed in Niger – and also in Mali and Burkina Faso – supports a far larger population than could have survived there in the past. As Dennis Garrity of the World Agroforestry Centre told Bilger, “It’s counterintuitive, but it’s true; the more people, the more trees.”

Agroforestry has proven potential to reclaim arid regions everywhere. When editing EcoWorld, I reported on successful examples of agroforestry reversing deforestation in India’s Rishi Valley (India’s Rishi Valley Renewal,  1996), El Salvador (Reforesting Central America with TWP, 2000), and Costa Rica (Profitable Reforesting, 2005).  Back in the 1990’s I enthusiastically wrote about agroforestry as a financially sustainable way to restore deforested regions, with posts such as “What About Sustainable Nurseries?” and “Autarky After the Roar“. Indeed, the stated mission of EcoWorld for the 14 years that I was editor was “To double the timber mass of the planet within 50 years” (by 2045).

Not only is agroforestry a financially sustainable way to reverse deforestation – with all that implies: enthusiastic local adoption, profitability, ability to increase the land’s carrying capacity, improved and sustainable agricultural output – but reversing deforestation may help increase rainfall in arid regions. In the post “Hydraulic Redistribution” references are provided to theories that mingle the disciplines of forestry and climatology. By extending the canopy of trees that transpirate water vapor, cloud formation is stimulated. When these clouds condense into rain, low pressure is created in the inland areas above these forests which pulls in maritime winds, bringing more clouds. It would be interesting to explore and hopefully uncover additional research in this area.

Meanwhile, agroforestry is a proven way to improve the quality of life for people living in the Sahel, at the same time as it restores the water tables, moderates the climate, and slowly revitalizes the Sahel as the vast buffer against the encroaching Sahara.

How Wall Street Bought the Public Employee Unions

Earlier this week, on December 7th, 2011, as reported by the San Jose Mercury, the “San Jose City Council votes 6-5 to place pension reform on June ballot.”

This plan is drawing fierce resistance, but there are two financial considerations that most critics of pension reform don’t take sufficiently into account when making their arguments:

(1) Pension contributions are very sensitive to how much the fund can earn. A pension that earns 3% per year, i.e., allows someone who works for 30 years to retire with a pension equivalent to 90% of their final salary, will require a 10% increase in annual required contributions (as a percent of pay) for every 1.0% the earnings on the pension fund drop. That is, if the contribution to a firefighter’s pension is currently 35% per year (based on employer and employee contributions combined), and CalPERS lowers their expected rate of annual return by just 1.0%, from 7.75% to 6.75%, then the required annual contribution as a percent of salary goes up to 45% per year.

(2) The rate of return being currently maintained by most pension funds, 7.75% per year, is much higher than can be sustained going forward. A key reason for this is because equity growth over the past 20-30 years, and especially over the last 10-15 years, was fueled by increasing debt. By enabling massive borrowing – consumer, commercial and government – more consumer spending was in-turn enabled, which increased corporate profits which increased equity values. Now global debt has reached its maximum, we are going to deal with slower growth and hence lower rates of return for pension funds. The other key reason for the inevitability of lower pension fund returns is demographic. With baby-boomers now beginning to retire, and with public sector workers now retiring with these far more generous pension plans (they were only raised about 10 years ago), there are more people selling equities than ever before in order to finance retirements. Equity values are a function of supply and demand, and public sector pensions are going to be doing a lot more selling to finance pension payouts than ever before. The chances that the major pension funds in the United States can continue to earn 7.75% year after year are virtually zero.

Pension reforms such as San Jose Mayor Chuck Reed’s proposal should be supported.

The San Jose proposal may actually do enough to restore financial solvency to a public employee pension plan. Eventually raising the employee’s withholding to as much as 25% of their pay begins to contribute enough money to fund these plans, especially when combined with accruing benefits at no more than 2.0% per year, and deferring retirement to age 57 or higher.

Here are a few questions and answers about public sector pensions:

QUESTION: Aren’t pension critics, or “reformers,” if you will, trying to ignore the contractual commitments they made as taxpayers, simply because they become more costly than originally expected?

ANSWER:
Nobody “agreed” to these contracts as they have turned out. When pension upgrades were sold to politicians by Wall Street lobbyists they were represented as being nearly free to taxpayers because market based returns would cover the costs. Politicians didn’t understand the financial risks and voters were never told about it. To be fair, even the union leadership had no idea what they were getting themselves into.

Let’s put it this way – if somebody sold you a car, and said the payments would be $250 per month, then five years later said the payments would be raised to $1,000 per month, then five years after that said the payments would be raised to $2,500 per month, would anyone “like” that? And how would the holder of the loan appear – when they say “a deal is a deal” and try to force you to pay up?

In any event, opponents of pension reform should review the two financial points made earlier, because bankruptcy will void these contracts, and bankruptcy is staring every city and county in California in the face.

QUESTION: Everyone agrees that some kind of public pension reform is unavoidable, and that is exactly what is underway now. But can people who want to change public sector pension benefits legitimately claim that Chapter 9 is a magic bullet that will suddenly relieve everyone of the legal obligations that have been made on their behalf by their elected representatives?

Now that the bill for pension obligations is coming due, wouldn’t reneging on these obligations constitute theft?

ANSWER: “Theft” is how public sector unions have stolen our democracy and “negotiated” these unsustainable pensions with politicians they elected. Public sector pensions, on average, are five to ten times better than social security. The arcane and onerous details of pension obligations were buried in the fine print of these “contracts.” To imply that taxpayers are somehow the thieves for wanting to reduce pension costs down to the levels they were originally ignores the sheer scale and generousity of these financially unsustainable pensions. The 2010 annual reports from CalPERS and CalSTRS document that the average pension for a newly retired government worker in California after 30 years of work is nearly $70,000 per year. If every Californian over the age of 55 received that much in retirement it would cost $700 billion per year, nearly 40% of the entire GDP of the state! It’s impossible. It can’t go on. It is oppression and a recipe for economic ruin.

The bottom line is this – public sector unions and Wall Street are now in bed together, betting trillions of dollars in the markets with their pension funds, trying to eke over-market returns through aggressive fund management, with the taxpayers forced to pay up when they can’t hit their numbers.

From the CalSTRS Annual Report, page 135:

CalSTRS participants who retired during the 12 months ending June 30th, 2010 (the most recent data), earned pensions as follows:
25-30 years service, average pension $50,772 per year.
30-35 years service, average pension $67,980 per year.
35-40 years service, average pension $86,736 per year.

From the CalPERS Annual Report, page 151:

CalPERS participants who retired during the 12 months ending December 31st, 2009 (the most recent data), earned pensions as follows:
25-30 years service, average pension $53,182 per year.
30+ years service, average pension $66,828 per year.

QUESTION: Isn’t it true that the longer someone works in any pension system, the higher their eventual benefit is likely to be? Doesn’t it work that way with Social Security, up to the cap?

ANSWER: The social security cap is about $31K per year after 40+ years of full time work, which equates to well less than 20% of the payee’s annual income. There is no cap on public sector pension payments, which are averaging nearly $70K per year, and they are averaging over 66% of the payee’s annual income, after only 30+ years of work.

Nearly everyone in America was purchasing more than they could afford during the internet/housing bubbles, but lobbyists hired by public sector unions, alongside lobbyists hired by Wall Street, are trying to make our politicians enshrine the pension liabilities – sold by Wall Street lobbyists to union-backed politicians – permanently into our tax code. And together, Wall Street and public sector unions have made public sector agencies collection agents for Wall Street. Wall Street hedge funds now bypass brokerages to manipulate market liquidity and asset values, and public sector pension funds are the biggest players on Wall Street. This is a corrupt system and cannot be fixed until taxpayer backed pension funds that can extract by “contract” 7.75% returns – either from investment returns or from taxpayers – are dissolved. And why shouldn’t public sector pension funds be the biggest players on Wall Street? Not only do they control about $4.0 trillion in assets, but they have the full backing of the public sector unions, the politicians they control throughout America’s states, cities and counties, and the taxpayers as the final guarantors.

Public sector pension funds and the social security fund should be all merged into a single fund, and the combined assets should be systematically moved into either cash or treasury bills, eliminating the speculators, eliminating most of the expensive financial bureaucrats of all stripes, and getting the government and Wall Street out of the business of fleecing taxpayers. And one, uniform and financially sustainable retirement incentive formula would be offered to ALL retired American workers, public or private.

For much more on the benefits and the feasibility of merging all public employee pension funds with social security, read “Merge Social Security and Public Pension Funds.”

Merge Social Security and Public Pensions

When solutions to the challenge to provide retirement security to American citizens in the 21st century are considered, they typically address either social security or public sector pensions, but rarely focus on both of these systems together. But when considered together, as systems that each have unique strengths and weaknesses that might be combined in a single program available to all Americans, options present themselves that might otherwise be ignored.

With both social security and public sector pensions, the challenge of maintaining financial sustainability is dramatically affected by the demographic reality of an aging population. As increasing numbers of people live well into their eighties and nineties, the ratio of workers to retirees edges closer and closer to 1.0.

There are four ways to address the reality of an aging population: (1) Increase withholding from current workers, (2) Increase the retirement age, (3) Lower the level of retirement benefits, and (4) Increase the amount the retirement trust fund can earn. Before delving into each of these further, however, it is important to identify one crucial advantage the USA enjoys vs. virtually all other major developed nations. America, alone among major nations, is projected to have a perfectly even distribution of ages within her population.

AMERICA’S DEMOGRAPHIC ADVANTAGE

America, like all developed nations, has an aging population. But as the four charts below indicate, unlike all other major developed nations, America’s population is replacing itself at an even rate. It is difficult to overstate the serendipity of this phenomena, nor the advantage that it imparts to policymakers intent on engineering sustainable retirement security for American citizens. Not only does having an even age distribution, with an equal number of people in every age group, guarantee that America’s worker-to-retiree ratio will be more favorable – higher – than that of other major nations – but, as will be seen, this higher proportion of productive workers yields other significant economic benefits.

Here are the projected age distributions in 2030 for the 2nd, 3rd, and 4th largest economies on earth, China, Japan, and Germany (the Eurozone economies, in general, have an age distribution similar to Germany’s):

For each of these nations, what can be seen are a large proportion of individuals who are either in their late working years or retired. In each case, the number of people under the age of 10 are only about half as numerous as the number of people aged 55-65. These nations are on track to have a worker to retiree ratio – all else being equal – that is literally half as favorable as the USA, as can be seen on the next table:

America’s success in replacing her population to create an even distribution of ages makes meeting the challenge of retirement security far more feasible than it will be in the rest of the developed world. This advantage, however, does not mean that America’s retirement programs do not face wrenching challenges. America may be on track to have a sustainable population, which is good, but America is still an aging nation. Starting in 1946 with the so-called Baby Boom, American’s produced about 4.5 million babies each year. This was an unprecedented number of children being born in the U.S., which meant that even as the WWII generation retired and enjoyed life average expectancies that set new records, their children grew up and populated the workforce in numbers that greatly exceeded the number of retirees. Now that the baby boomers themselves are retiring, the ratio of workers to retirees in America is lowering. Because, unlike the Europeans or East Asians, Americans are replacing themselves, this will be a one-time lowering. But it represents a huge adjustment.

THE COST OF PUBLIC SECTOR PENSIONS VS. SOCIAL SECURITY

Complicating the challenges of funding retirement security for an aging population is the generosity of the pension programs that have been granted government workers in America. It is difficult, if not impossible, to get exact amounts paid in aggregate to retired government workers, but here is a useful equation that allows one to estimate and compare the amount paid to government workers, in total, to the amount paid to social security recipients, in total. The case can be made that we are already on track to spend more each year on public sector pensions to retired government workers, who represent 20% of the workforce, than we spend on social security to the entire population of retired private sector workers, representing 80% of the workforce:

(public sector pensions)   1.5S x 67% x 30%  >  S x 33% x 70%   (social security)

In the above equation, “S” denotes the average salary of a private sector worker. Because the average government worker earns 50% more, on average, than the average private sector worker, their salary is denoted as “1.5 S.” The next variable is a percentage showing what, on average, the typical public sector pension is as a percent of final salary, 67%, vs. what, on average, the typical private sector social security benefit is as a percent of final salary, 33%. Finally, the last percentage in each equation shows the percentage of the retired population receiving a public sector pension, 30%, vs. the percentage of the retired population receiving social security, 70%. An observant reader will immediately question why a 70/30 ratio of retired public sector workers to private sector workers is used, since public sector workers only comprise 20% of the workforce. This is because the average public sector worker retires ten years earlier than the average private sector worker, hence they may only represent 20% of the working population, but they are 30% of the retired population.

If you calculate these variables, you will see that expenditures per year to support public sector workers in the U.S. are on track to exceed the total social security payments by a ratio of 1.3 to 1.0. This ratio doesn’t currently apply, because many public sector workers retired at a time when the benefit formulas were far less generous than they are for current workers (ref. Government Worker Understates Average Pension).

For a much more expansive analysis of the disparity between social security payments and public sector pension benefits, including links to source data, using California as an example, ref. The Cost of Government Pensions. Here are some charts from that analysis that underscore the point made in the preceding paragraphs:

In the above table, it can be seen the result of an average retirement age of ten years earlier for public sector workers translates into a 1-to-1 ratio of workers to retirees, since the U.S. enjoys an even distribution of ages within the population. This is based on assuming an average age to commence working of 25 and an average life expectancy of 85. In all, a 60 year span between beginning work and death is probably reasonable. Under this scenario, the private sector workforce is on track, at an average retirement age of 65, to have a 2-to-1 ratio of workers to retirees.

In this table, using data for California (ref. source links in The Cost of Government Pensions), it can be seen that the average public sector worker makes 1.5 times as much in base salary than the average private sector worker. Based on data from CalPERS and CalSTRS, the average pension for public sector retirees in California who have worked 30+ years and have recently retired is well in excess of $45K per year, but 66% is a good conservative benchmark to use for comparison, particularly since it is difficult to access a national average for all state and local government workers. The $15K per year national average for social security is well-documented, and equates to about 33% of the average annual private sector wage.

This table puts together the preceding data for California’s retired population and projects a $110B per year outlay in pension payments to support 2.4 million retired public sector workers (local, state and federal), compared to a projected $95B per year outlay for 6.1 million retired private sector workers. What both the equation “1.5S x 67% x 30%  >  S x 33% x 70%” as well as the three tables above are intended to convey is a startling fact: The United States taxpayers going to be spending MORE on payments to public sector retirees, comprising 20% of the workforce, than they will spend per year on social security payments to the entire population of private sector retirees, comprising 80% of the workforce.

DUBIOUS PREMISES OF PUBLIC SECTOR PENSION FUND INVESTING

Before delving into scenarios whereby the social security fund and the public sector pension funds in the United States can be combined into one single system where the same formula is applied to all citizens, it is important to explore something unique to public sector pension funds; the fact that these funds are invested, and that returns on these investments yield additional capital that can be used to help meet pension payment obligations to retired government workers.

There are a host of fallacies and dubious premises that accompany the practice of relying on investment returns to shield taxpayers from fully funding government worker pensions. While all of these are debatable, they would include the assumption that government workers, funded by taxpayers, shall reap the financial rewards of investment returns, yet social security recipients shall not. Or the assumption that these government employee managed, labor union influenced, massive pension funds – pouring hundreds of billions through Wall Street brokerages every year – do not exercise a distorting influence on market returns, inordinately influence corporate governance, carry a political agenda, invest offshore, or aren’t themselves engaging in a mutually corrupt partnership with aggressively managed hedge funds that extract over-market returns using manipulative tactics in a zero sum market – i.e., causing lower-than-market returns for small investors who rely on their 401K investments for their retirement. But the most dubious premise of all is the myth that these pension funds can project long-term annual rates of return (after inflation) of nearly 5.0%.

There are two reasons that rates of return of 7.75% per year cannot be achieved (4.75% after adjusting downwards for inflation – this is CalPERS and CalSTRS official long-term projected rate of return, and is fairly typical of the rates used by most other public sector pension funds). They are the trends of demographics and debt. In the case of the public sector pension funds, the demographic challenge is compounded by the fact that new retirees, on average, receive far more generous benefits than existing retirees.

THE DEMOGRAPHIC CHALLENGE

The demographic challenge to 7.75% rates of return is a matter of simple supply and demand. When the worker-to-retiree ratio for public sector workers reaches 1-to-1, and when long-time public sector retirees are enjoying pensions that are derived using the same formula as workers just entering retirement – both of these things will happen if current policies aren’t changed – then for the first time, the massive government employee pension funds, currently managing about $4.0 trillion in assets in the United States, will be selling as many equities as they are buying. With funds this large, this will completely change the dynamics of the market.

The larger private sector workforce also is trending towards a smaller worker-to-retiree ratio, moving from today’s approximate 3-to-1 ratio to a 2-to-1 ratio by 2030. Presumably these private sector retirees will collectively own additional trillions in equities. In 2030, for every two private sector workers purchasing equities to eventually use when retired, there will be one retiree who is selling equities. This move from a 3-to-1 buyer-to-seller ratio to a 2-to-1 buyer-to-seller ratio will also have a dramatic macroeconomic impact on stock prices. There will be less demand for stocks and other passive investments because there will be more sellers than ever.

THE DEBT CHALLENGE

The debt challenge to 7.75% rates of return is, if anything, more daunting than the demographic challenge. The accumulation of debt in the U.S. enabled faster economic growth than would have otherwise occurred. Inflated asset values, especially private homes, enabled trillions in borrowing at unusually low rates. These trillions were immediately plowed back into the economy on consumer products or more homes, fueling both corporate profits and home prices – which raised the value of corporate equities and enabled further borrowing. The table below, documented with links to source data in the post “National Debt and Rates of Return,” shows the aggregate total market debt for the United States economy as a percent of GDP for the last 120 years:

The data for the above table is gathered from three sources, which all corroborate a sobering fact – the total debt in the U.S. is currently higher than it was during the great depression in the 1930s. Currently the reported total debt / GDP ratio in the United States is 370% and rising. At the height of the great depression, total debt / GDP was barely 300%. The above table breaks the last 120 years of American history into four 30 year financial eras. In all four 30 year periods, the total U.S. debt fluctuated between 140% and 160% of GDP. Two of the 30 year periods, the those beginning in 1890 and 1950, respectively, saw debt as a percent of GDP display very little variation. For example, between 1890 and 1920 the maximum debt/GDP ratio was 165%, and the minimum debt/GDP ratio was 125%. For the period beginning in 1950 the variation was even more unremarkable, with the 1950 beginning level of 140% comprising the lowest ratio, and the 1980 ending level of 160% comprising the highest ratio. This parallel between the two relatively stable periods makes any parallel one may infer between the two relatively unstable periods quite ominous. Because the 300% debt/GDP extreme achieved in 1930 took 20 grueling years to unwind.

During this same 20 year period, between 1930 and 1950, the Dow Jones Index moved from 286.10 downwards to 206.05. To the extent this stagnancy was caused by slower economic growth due to mandatory deleveraging, there is no reason to expect any growth whatsoever from publicly traded equities in the U.S., since debt today is a higher percentage of GDP than it was in 1930. The reality of an aging population, which increases the seller-to-buyer ratio in the equities markets creates an additional downward pressure on returns that was not present in the 1930’s.

These trends occur against the backdrop of a stock market that never recovered from the crash of 2000. As referenced in the post CalPERS Projected Returns vs. Reality, here is a chart of the Dow Jones Industrial Averages staring in January 2000, and running through mid-August 2011 (they haven’t changed significantly since then):

What is immediately clear from viewing this chart is that where the index began, nearly 12 years ago, and where it is now, are pretty much the same. To be precise, the Dow entered the week of January 4, 2000 at 11,522, and the Dow entered the week of August 8, 2011 at 11,269 (ref. Yahoo Finance – DJIA 1-2000 to 8-2011). The Dow has actually declined over the past 10.5 years.

Moreover, this loss of equity value should be measured using inflation adjusted dollars, not nominal dollars. If you review the Consumer Price Index from the U.S. Dept. of Labor, you will see that in January 2000 the index stood at 168.8, and in June 2011 the index stood at 225.7. This means that it would take $1.33 today to purchase what $1.00 would have purchased in 2000. From this perspective, the Dow index today would have to stand at 15,406 just to have kept up with inflation. Put another way, in real dollars, the Dow has lost 2.67% per year for the last 11.5 years.

One might argue that the Dow is not representative of the U.S. equities market, because the arcane formula that governs its calculation only incorporates a handful of blue-chip companies. Below is the S&P 500, an index that tracks 500 of the largest publicly traded companies, most of them based in the U.S. and traded on the New York Stock Exchange:

On this chart it is obvious that even in nominal dollars, the S&P 500 is lower today than it was nearly 12 years ago. As it is, the S&P 500 entered the week of January 4, 2000 at 1,441, and the Dow entered the week of August 8, 2011 at 1,179 (ref. Yahoo Finance – S&P 500 1-2000 to 8-2011). When you take into account inflation, the S&P 500 today would have to be at 1,927 just to break even with where it was 11.5 years ago. Put another way, in real dollars, the S&P 500 has lost 4.19% per year for the last 11.5 years.

PENSION FUND CONTRIBUTIONS ARE VERY SENSITIVE TO RATES OF RETURN

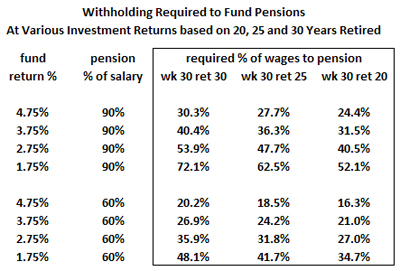
When analyzing the variability of required pension fund contributions based on 30, 25, and 20 year retirements, while assuming 30 years of work, the results on required contributions are dramatic. These calculations, including tables showing their complete methodology, using as examples the typical pension plans offered California’s safety and non-safety public sector workers, are explored in depth in the post “What Percent of Payroll Will Keep Pensions Solvent.” Here is the summary:


In the above table, the first set of four rows show various scenarios based on a pension equivalent to 90% of final salary, the second set of four rows show various scenarios based on a pension equivalent to 60% of final salary. One might suggest the first set of rows depicts public safety workers, representing approximately 15% of California’s 1.85 million state and local government workers, and the second set of rows depicts everyone else working for state and local government agencies in California.

For each pension example, the fund return is calculated at a best case of 4.75% per year, which is the official rate used by CalPERS currently, and is the rate used by most public employee pension funds across the U.S. That return is then dropped by 1.0% in each of the next three rows. It is important to note that these are “real” returns, after inflation, which is typically projected at 3.0% per year. In nominal terms, CalPERS official long-term projected rate of return is 7.75% per year. So in nominal (before adjusting for inflation) terms, the four returns evaluated on this table are 7.75%, 6.75%, 5.75%, and 4.75%. To keep this in perspective, the “risk-free,” nominal rate of return on the 10 year Treasury Bill is 3.0% per year, nearly two percent lower than our worst case scenario in this analysis.

As can be seen by reviewing the first column in the boxed set of data on the table, when someone works 30 years and is retired 30 years, and has a pension equivalent to 90% of their final salary, if you drop just one-percent from CalPERS official long-term projection, you have to increase the annual pension fund contribution by 10.1% of salary – from 30.3% per year to 40.4% per year. And if you want to be even more realistic when estimating necessary public sector pension fund contributions going forward, take into account pension spiking, staggering losses to the funds over the past 10 years, and retroactive pension benefit increases.

To expound further on what may be a realistic rate of return for multi-trillion dollar retirement funds in an economy with an aging population is beyond the scope of this analysis. For the proposed options to follow, the operating premise is that such funds, at best, will not yield returns that exceed the real rate of broader economic growth. Especially due to the aging population which creates more retirees who are sellers in the market. And mid-single digit economic growth will remain elusive as long as total market debt exceeds 370% of GDP.

TAXPAYER-FUNDED RETIREMENT SECURITY REQUIRES ONE-FORMULA FOR ALL

If one strips away the reliance on investment returns and compares social security to public sector pensions based on payroll withholding from current worker’s providing 100% of the funds required to make current payments to retirees, it quickly becomes obvious that public sector pensions are completely unsustainable, whereas social security can be rendered permanently solvent with relatively minor tinkering. Here’s why:

Public sector pensions pay retirees, on average, 2/3rds of what they made when they worked, and based on an average retirement age of 55, there will be one worker in the public sector for every retired public sector worker. This equates to 66% withholding on current government workers to fund retired government workers. Social security, by contrast, pays retirees, on average, 1/3rd of what they made when they worked, and based on an average retirement age of 65, there will be two private sector workers for every retired worker collecting social security. This equates to 16% withholding on current private sector workers to fund workers who have retired on social security.

Social Security and public sector pensions have something in common; they are both defined benefits. Retaining the defined benefit at some level to provide a minimal safety net to all citizens is something for which most Americans would agree. Determining what level of defined benefit is both adequate and financially sustainable is harder. But the exercise is simplified if you eliminate the inherently corrupt practice of investing taxpayer’s retirement funds in speculative investments. It is also simplified by the fact of America’s even age distribution, which makes the actuarial calculations far less complex. Using these assumptions, a average defined benefit equal to 1/3rd of salary can be provided to all American’s, if they are willing to contribute 16% of their salary to a retirement fund.

There are two elements to social security’s defined benefit formula that are absent from the defined benefit enjoyed by public sector workers. The first is the progressive nature of social security. A low wage earner may actually collect a social security benefit equaling as much as 50% of their income, whereas a high wage earner’s social security benefit will probably be closer to 10% of their income, or less. The second is that the social security plan adds up the entire career earnings of each beneficiary in order to calculate their entitlement, whereas public sector pensions are typically calculated by multiplying the number of years a beneficiary worked by a factor (usually between 2% and 3%), and multiplying that result by their final year’s earnings. Both of these elements belong in a merged plan; one to create more equity for low income earners and to place a cap on the maximum benefit, the other to take into account the total earnings history of each beneficiary to more equitably calculate how much they may receive.

By incorporating progressive benefits, imposing a cap on benefits, and raising the annual ceiling at which earnings become exempt from withholding, it may be possible to sustainably pay out an average pension to low and middle income wage earners that exceeds 33% of their average career earnings. Raising the retirement age to improve the worker-to-retiree ratio can also accomplish this. When exploring retirement security options based on this pure pay-as-you-go system, one can quickly visualize both a reasonable, sustainable retirement safety net for all citizens, as well as grasp just how problematic it becomes to raise taxpayer funded retirement benefits much beyond 33% of average annual career earnings.

AMERICA’S ECONOMIC ADVANTAGES

While the U.S. confronts an aging population and crippling levels of total market debt, the U.S. is nonetheless clearly positioned as having the strongest and most resilient economy in the world. America’s age distribution, while in transition to an older average age, has the unique virtue of being perfectly evenly distributed. New workers are replacing retiring workers at a 1-to-1 ratio, and the overall ratio of workers to retirees will never dip below 2-to-1. No other major economy has this advantage; most of them face a desperate shortage of new workers. This will ensure not only sufficient payees into any retirement security scheme, but it will ensure adequate numbers of workers to produce goods, and adequate numbers of workers to consume them. It is difficult to imagine how America’s sustainable demographic profile will not grant her a significant economic advantage over the other major economies of the world over the next 20-30 years.

Surprisingly, America’s debt profile, while dire, is comparable to most other major nations. The chart below shows the estimated amount of available credit, by major economy, based on known levels of total debt in each economy, compared to their estimated collateral expressed as a multiple of GDP. For the purposes of comparison, available credit is calculated by assuming a nation’s collective borrowing remains viable up to an amount equivalent to 50% of their collective assets. As can be seen, the absolute value of each nation’s GDP has a decisive effect on the calculation, since countries with much larger GDPs such as the U.S. have as much remaining borrowing capacity – 19.8 trillion – as the much smaller Chinese economy – 22.4 trillion – despite the fact that China has a debt/equity ratio of 5% vs. America’s 36%.

At first glance this chart suggests that the U.S., with a debt/equity ratio of 36%, is in considerably worse shape than the Eurozone and China. But this chart was compiled nearly a year ago (ref. National Debt and Rates of Return) and is based on a huge assumption: Debt in the Eurozone and China were simply assumed to be triple their reported government debt.

Starting with Europe, the problem with this assumption is that the European banks have issued Euro bonds that aren’t calculated on any national balance sheet. Retirement obligations and current worker entitlements in Europe have stressed their borrowing capacity and threaten the very existence of their currency. China’s economy, while logging formidable growth over the past 20 years, is overly reliant on exports and construction. While the Chinese don’t appear to have a serious debt problem based on the simplistic assumption that their total debt is merely 3x reported government debt, their banking system is opaque, their real estate assets are grossly overvalued, and their exports cannot possibly continue to grow at the rate they have. Just a slowdown in the rate of export growth could have a sharply negative impact on China’s asset values – and when collateral collapses, debt as a percent of equity rises accordingly. And China’s fitful progress on human rights, along with Europe’s attempts at integration which may have peaked, guarantee these economies will struggle with social distractions unheard of in the U.S.

Finally, because of their impending demographic implosion for which neither of them are prepared, Europe and China face a very uncertain economic future. Japan, by contrast, has already experienced twin implosions – demographic and collateral – and with the worst behind them, Japan may surprise the world in the coming years. But Japan, with a $5.0 trillion economy and an imploding population, will never seriously rival the U.S. as the premier global economy.

ECONOMIC GROWTH IMPROVES RETIREMENT SECURITY OPTIONS

For the United States to flourish economically, she will have to reduce debt as a percentage of GDP while somehow managing to log rates of economic growth in the mid-single digits. More than anything else, this will require engaging in deficit government spending that yields long-term economic returns, rather than simply to pay out entitlements and inflated wages and benefits to government workers.

The economic problems in the rest of the world guarantee the U.S. dollar will remain a hard currency. They mean that the Chinese yuan will not deliver a sustained appreciation against the dollar, even if they finally float their currency on open markets. They mean that the Euro, even if it survives, will also be regarded as less stable than the dollar. The size and diversity of the American economy, the demographic sustainability of the American population, the stability of American society, and the historic status of the U.S. dollar as the reserve currency of the world are all contributing factors to the likely appreciation of the dollar for the next few decades.

The infrastructure projects of the 1930’s should provide inspiration to policymakers and economic planners today. The impact of these roads, dams, and power infrastructure were clear – they lowered the cost of living at the same time as they raised the standard of living. Unlike today’s seductive but economically disastrous “green” initiatives, infrastructure investments of the 1930’s made transportation, water and power cost less. This policy decision of the 1930’s – investing government funds to lower the cost of living – gave people more discretionary income to purchase new inventions – radios, cars, home appliances. And these new inventions created new asset classes which created new collateral, improving the overall national debt/equity ratio.

This is where government investment should go, into 21st century versions of the big projects of the 1930’s whose legacy still provides benefits to the American people. We need practical public works projects that will lower the cost of transportation, water and energy. We need upgraded freeways with “smart lanes” where ultra-efficient cars and buses will eventually drive themselves. We need to upgrade existing rail lines and limit the building of “bullet trains” to where they might be cost-effective; maybe Washington to Boston but probably nowhere else. We need to develop nuclear power, clean coal, shale oil and gas, and lower the cost of energy. We need to build cost-effective desalination plants and new water storage and distribution infrastructure – and to make these massive projects affordable and for the greater good, we need to roll back or eliminate unnecessary environmental regulations, environmentalist lawsuits, and project labor agreements.

Along with infrastructure investments, the federal government should invest in high-technology, which is essential to maintaining economic preeminence. A mission to Mars, a lunar base, and multiple orbiting outposts would consume hundreds of billions in funds, but result in almost unimaginable commercial growth and technological spinoffs. The federal government should also increase investments in basic science and medical research. As infrastructure investments lower the costs for energy, water, and transportation, and technology investments create new options for entrepreneurs, entirely new industries can spontaneously emerge in the private sector, from space commercialization to life extension, to things we can’t imagine today.

To fund these investments without increasing the deficit requires revisiting entitlement reform and eliminating special, cripplingly expensive pensions for government workers. While some classes of government workers may qualify for a premium when calculating their retirement compensation, such as those who operate in the military or high-risk public safety jobs, there is no reason why the vast majority of government workers should get anything other than a new and upgraded, economically sustainable social security benefit.

In order to minimize disruption to the markets, public sector pension funds can be liquidated systematically over a ten year period. They can be moved slowly but steadily into investments of minimal risk, such as ten year treasury notes, and placed under the administration of the Social Security Trust Fund. Moving these funds into T-Bills will also help finance the deficit until GDP growth raises tax revenues. And to preserve America’s demographic advantage as well as nurture her technological prowess, immigration laws need to be restructured to emphasize admission of highly educated and highly skilled workers.

These are prescriptions for economic growth, which will improve the options for whatever retirement benefit formulas are adopted.

If the U.S. were to merge all taxpayer supported retirement entitlements into social security, it would fund the revitalization of the U.S. economy. Redirecting government spending into productive investments instead of entitlements would create an economic boom that would create opportunities for all Americans. By moving the government out of the business of making speculative investments through Wall Street brokerages, that special interest as would see a significant erosion of its power and influence. Perhaps most important of all for a global perspective, the 21st century might then follow the 20th as another American century, a most desirable outcome for those who believe in the American experiment, in democracy, in pluralism, in competition and capitalism, innovation, progress, and the optimism and big ideas that have always defined America in the eyes of the world.

Why Not “Occupy” Public Sector Pension Funds?

A CIV FI post back in January 2010 entitled “Axis of Wall Street & Public Sector Unions” identified an irony still lost on the occupy movement’s rank and file – Wall Street is financed by the pension funds of unionized government workers. Every year, taxpayer funded government agencies pour hundreds of billions of dollars into Wall Street investment funds.

Occupy Wall Street? Why not “occupy” Wall Street’s union paymasters, the government employee pension funds?

Here’s a summary of the dynamics between Wall Street, unionized government workers, and the taxpayer:

(1) The government workers provide services vital to the taxpayer, and charge the taxpayer, on average, about 40% of their income (middle class worker, all taxes – state, federal, social security, medicare, property, sales) to receive these services.

(2) The government workers receive, in addition to their normal pay, funded by these taxes, pensions that are, on average, five times better than what taxpayers get from social security (the average government pension is $60K per year with an average retirement age of 55, the average social security benefit is $15K per year with an average retirement age of 65).

(3) The government workers tell the taxpayers – don’t worry – you don’t have to pay additional taxes for us to get these generous pensions, because we’ll invest the money on Wall Street, and Wall Street will earn 7.75% per year on these investments.

(4) Wall Street invests the taxpayer’s money, funneled through the government worker pension funds, demanding a return of 7.75%. To achieve this return, they invest in hedge funds and other manipulative, highly speculative investments. This increases the volatility of the markets, crowds out small investors, and drives down returns for small investors.

To fund government worker pensions, what has happened is the government workers have taken the taxpayer’s money, and essentially lent it back to the taxpayers at a rate of 7.75% – at a time when 30 year mortgages are below 4.0%, the 10 year treasury hovers at around 2.0%, and the rate of GDP growth is at or below 3.0%, which is roughly the rate of inflation.

Taxpayers provide the seed money for pension fund investments, these investments are aggressively managed which undermines the individual retirement investments the taxpayers make for themselves, then when the pension funds ultimately fail to meet their 7.75% targets, the taxpayers are assessed to cover the losses. Triple jeopardy.

Every time another public sector union or government pension fund spokesperson claims that taxpayers do not bear the brunt of funding public sector pensions, read between the lines, and this is the rest of the story.

The truth is contagious.

On November 18th a prominent Southern California blogger of indeterminate political leanings (certainly no rock-ribbed conservative), Will Swaim, published an expose of his own entitled “How the revolutionary California labor movement became Wall Street’s biggest gambler.” Here are some excerpts from Swaim’s inimitable prose:

“CalPERS is to Wall Street what a whale is to a Vegas Casino. A high roller. A player. The biggest swinging male appendage in the room. With $235.8 billion in assets, it is the nation’s largest pension fund, and among the biggest investors in the world. And it’s largely on the expected gains in its Wall Street investments that CalPERS has been able to persuade officials in many California cities and counties that they could pay rising pension benefits to their public employees…”

“It wasn’t always this way. For decades after its 1931 founding as a pension program for state workers, CalPERS—then called the State Employees Retirement System (SERS)—made stodgy, sure-thing bond investments. That changed in 1953 when the legislature allowed SERS to invest in real estate. Thirteen years later, there was another loosening of the restraints on the agency’s investments when state voters passed a union-backed proposition allowing CalPERS to invest a quarter of its portfolio in stocks. In 1984, high on the fumes of the Reagan Revolution, labor pushed Prop. 21, allowing CalPERS to invest anything/everything in Wall Street. CalPERS had become a whale…”

“You can begin to see the confluence of forces that would generate a pension problem when you also consider that, with life-expectancy rising and retirement-age falling, California offered public workers more generous pension benefits. In 1932, that benefit was 1.4 percent per year of service; the percentage increased to 1.6 percent under Gov. Warren, and to 2 percent when Gov. Ronald Reagan took over the Governor’s Mansion in Sacramento. It’s between 2 percent and 3 percent today…”

“CalPERS has a reputation as an activist investor. The organization has insisted on quid pro quos: in exchange for investment cash, it has pushed for caps on executive pay and transparency; has led the way for human rights, environmental and labor standards in emerging markets; and participated in class-action lawsuits against major health insurance companies, including UnitedHealth Group…”

“Leveraging that tradition, the city’s workers could reform their union and its bloated pensions. They could start by demanding that CalPERS invest their pensions in solid/stolid/boring U.S. bonds rather than in the speculative junk that fueled Wall Street’s rapid, unprecedented rise through the 1990s and its post-scriptural crash in 2008. That might—might—mean more modest retirements, of course, but it would certainly end union members’ hypocritical reliance on Wall Street—their affection for gambling when Wall Street inflates their pensions, their hatred of the market when it shapes the contours of their daily work…”

Government Pensions Increasing Hedge Fund Investing

In less than five years California will have over 10 million residents who are over the age of 55 (ref. U.S. Census, California Demographics). If every one of these people were to receive a pension equivalent to what the average public employee in California can now expect after working full-time for no more than 30 years, it would cost taxpayers nearly $700 billion per year. To put this in perspective, $700 billion is 40% of California’s entire gross domestic product.

When spokespersons for California’s public sector unions claim that pension reformers are “trying to destroy the middle class,” they should be asked this question: How on earth can any system of retirement security – not even including health insurance benefits – possibly expect to consume 40% of the entire economic output of the state or nation in which such benefits are being provided, and yet remain financially sustainable? Universal and equitable retirement security in America will never be realized by offering everyone the deal that public sector employees currently receive. Their benefits must be reduced. But instead, government worker pension funds are making riskier investments.

Public sector pension funds rely on investment returns to make up for the shortfalls in taxpayer revenues. But can investment returns really hope to sustain public sector pensions when there are as many people drawing pensions out of the fund as there are people (and taxpayers) contributing money into the fund? That tipping point, where there is as much money going out as there is going in, has not yet been reached, since most pensioners in the system currently are drawing benefits that were calculated when pensions formulas were far less generous. For example, a teacher who retired in 1985 and is still alive will receive today a pension of barely $30,000 per year. A teacher of the same seniority retiring in 2010 after a 30 year career will receive a pension on average of $70,000 per year. This same sort of disparity applies across all public sector disciplines, and is the reason there is still more money going into public sector pensions than is being paid out. Once these pension funds start selling as many securities as they are buying, even more downward pressure will apply to stock prices than already applies.

As documented in “What Percent of Payroll Will Keep Pensions Solvent?,” for every 1.0% that the rate of return for a pension fund falls, the required contribution into the pension fund must increase by about 10% of payroll. This means, for example, that if CalPERS lowers their projected rate of return from 7.75% per year down to 6.75%, the contributions their members (or taxpayers) will have to invest in CalPERS every year will rise from (for example) 20% of payroll to 30% of payroll. It is difficult to overstate just how dire the pressure is on public sector pension funds to claim they can continue to earn 7.75% per year.

One way that public sector pension funds are trying to maintain their rate of return is by investing in hedge funds. These virtually unregulated funds utilize manipulative tactics to extract larger than market returns – often at great risk. But to beat the market, someone else has to lose. Public sector pension funds investing in hedge funds are encouraging a phenomenon – market manipulation – that is driving value investors and small private investors out of the market altogether. As reported in the Wall Street Journal on October 18th in an article entitled “Traders Warn of Market Cracks,” the dominance of program trading and other manipulative tactics is taking taking liquidity out of a market that is already in trouble:

“One surprising element of the fall-off in liquidity is that one key set of players actually appears to be more active in recent months: so-called high-frequency traders. These hedge funds use computer models to trade at a rapid pace. In recent years they have replaced brokerage firms as the go-betweens when investors trade stocks. But with so many other players stepping back from the market, the liquidity that high frequency traders are providing isn’t creating much of a cushion, traders say. In fact, some say they may be making matters worse.”

Yet public sector pension funds have to invest in hedge funds. They have to be high-risk players, exploiting the tactics that value investors would never consider and small investors could never afford – and THIS is the reason they claim they can outperform the small investors – because without these high-risk, manipulative, barely-legal, market-killing, short-term acts of desperation, they would already have to admit they cannot possibly earn 7.75% per year. And their actions only postpone that admission.

Here are some examples of how much money is now being poured into hedge funds by public sector pension funds, as documented in Private Investor Online:

“The New Jersey Division of Investment, which manages the state’s $71.6 billion in public pension assets, could put as much as $10.7 billion in hedge funds if it moves to a full 15% allocation. That would make the New Jersey fund the second largest hedge fund investor among P&I’s top 200 pension funds.

Another large pension fund looking to increase its hedge fund limit is the $108 billion Texas Teacher Retirement System, Austin.

Another Lone Star State fund, the $18 billion Texas County & District Retirement System, Austin, in March increased its target allocation to hedge fund as part of a new asset mix, confirmed Paul J. Williams, investment officer.

After two years of study, Connecticut Retirement Plans & Trust Funds, Hartford, finally moved its first $200 million into hedge funds, investing $100 million each in funds of funds with Prisma Capital Partners and Rock Creek Group.

The State of Wisconsin Investment Board, Madison, which oversees $83.3 billion, last year began to search for single and multistrategy hedge fund managers to run a total of $1.4 billion, as part of the rollout of its new hedge fund allocation;

The $154.7 billion Florida State Board of Investment, Tallahassee, early last year invested $250 million each directly in three activist hedge funds, but did not create a dedicated hedge fund allocation with a 6% target until June. Investment staff is at work getting the first 2% or $2.2 billion invested directly in single and multistrategy funds.

Colorado Fire & Police Pension Association, Greenwood Village, took its absolute-return investments down to zero in 2009 from 5%. The fund set a new 11% absolute-target and restructured the allocation to invest about 70% in hedge funds and 30% in commodities.

After nearly six years of study, three of the five pension fund systems within the $113.4 billion New York City Retirement Systems finally made large first-time hedge fund investments last month.”

Distilling all this arcana yields chilling realities. The public sector unions who claim Wall Street is to blame for our economic challenges are actually collection agents for Wall Street, at the same time as they are a corrupting influence on Wall Street. Year after year, they pour hundreds of billions of dollars of taxpayer’s money into some of the seamiest investment vehicles ever invented, bankrupting our cities and states to collect their tithe. At a time when assets are deflating everywhere, when the federal government is issuing 10 year notes at under 3%, the public employee pension funds are claiming they will continue to earn 7.75% on their money. They are essentially lending money at 7.75%, a grossly over-market rate, and forcing the smaller, private investors in the market to cover the difference.

If the market crashes again, and it might, look no further than your local public employee pension fund campus, that beachhead of Wall Street at its worst, to find an avid culprit. Public sector pensions are not sustainable, and the notion that they are is Wall Street’s last, biggest con.

Public Safety Compensation Trends, 2000-2010

Today’s Wall Street Journal published an article by Phil Izzo entitled “Bleak News for Americans’ Income,” where, citing U.S. Census Data, it was reported that U.S. median household income – adjusted for inflation – fell by 7% over the past ten years. In constant 2010 dollars, the average household in the U.S. saw their income drop from about $54,000 per year in 2000 to just under $50,000 today.

When debating what level of compensation is appropriate and affordable for public safety personnel, the average income of private sector workers is an important baseline. It provides context for determining whether or not the premium paid to public safety employees – for the risks they take – is exorbitant or fair. The trend of the past ten years is also an important baseline when making this comparison. For example, if the level of risk, the value we place on safety and security, and the degree of training required for public safety personnel have all elevated over the past decade – and they have – does this justify their pay increases exceeding the rate of inflation? Even over this past decade, when ordinary private sector workers have seen their total pay and benefits decrease by 7% relative to inflation?

Here then, also relying on U.S. Census data (ref. 2010 Public Employment and Payroll Data, State Governments, California, and 2010 Public Employment and Payroll Data, Local Governments, California, along with 2000 Public Employment and Payroll Data, State Governments, California, and 2000 Public Employment and Payroll Data, Local Governments, California), are the rates of base pay and pension obligations for California’s public safety personnel in 2000 (adjusted for inflation and expressed in 2010 dollars), and 2010, starting with Firefighters:

Several points on the table above bear explanation. These numbers reference firefighters who, typically, work 24 hour fire suppression shifts, and do not include administrative personnel. These work schedules usually involve three 24 hour shifts on duty, followed by six days off. If a firefighter works more than three out of every nine days, they receive overtime, which is included in these numbers. Worth noting is that when adjusting for vacation, the average mid-career firefighter in California works two 24 hours shifts every seven days, earning overtime for whatever extra days they work beyond that. Not included in these figures are any current benefits, including health insurance, or funding set-asides to cover retirement health insurance. We published a complete work-up of the total compensation of firefighters in August 2010 in a post entitled “California Firefighter Compensation.” In that analysis, the total compensation of the average Sacramento firefighter was estimated at $180,000 per year.

It is also important to explain the rationale behind the higher estimated pension costs (as a percent of salary) between 2000 and 2010. It was around 2000, and for several years afterward, that the “2.0% at 50″ benefit for public safety personnel was changed to the current “3.0% at 50″ formula – retroactively. The so-called “2.0% at 50″ formula meant that a firefighter was eligible to retire at any time after turning 50 years old, and would receive a pension equivalent to the number of years they worked, times 2.0%, times the salary they earned in their final year working. The “3.0% at 50″ formula increased this benefit, logically, by 50%. A firefighter now can retire any time after turning 50 years of age with a pension equivalent to the number of years they worked, times 3.0%, times the salary they earned in their final year working. The numbers shown on this table and the others, which represent the funding requirements per year expressed as a percent of salary, reflect the 50% increase required. These percentages assume 30 years working and 25 years retired, and they assume CalPERS will continue to earn 7.75% per year on their investments – 4.75% after adjusting for inflation. These are very conservative numbers, and indeed, most government agencies already set aside more than this into public safety pension funds. For much more on these calculations, refer to our analysis “What Payroll Contribution Will Keep Pensions Solvent?,” posted in July 2011, as well as the many links referenced as footnotes after the text and before the reference tables.

Here are pay and pension trends between 2000 and 2010 for California’s police officers:

And here they are for California’s correctional officers:

Here is a summary of this data: During the decade between 2000 and 2010, a period when, adjusting for inflation, household income for private sector workers fell by 7.0%, California’s firefighters saw their pay and pension benefits (after adjusting for inflation) increase by 33%, police officers saw their pay and pension benefits increase by 28%, and corrections officers saw their pay and pension benefits increase by 19%.

The next table attempts to quantify these costs in terms of their impact on California’s taxpaying households. While there are 12 million households in California, once you eliminate the nearly 50% of households who pay no net taxes, and the 15% (estimate) of households whose primary income comes from a government job, you’re down to about 5 million households. Corporate taxes, which presumably could cover some of these costs, are passed onto consumers in the form of higher prices. And these costs do not include anything other than pay and pensions – none of the other payroll overhead.

The above figures, all extrapolated from the data presented on the previous charts or from the U.S. Census Bureau’s tables linked to earlier, show salary and pension costs for California’s nearly 200,000 public safety personnel, expressed in billions. The first figure, $21.8 billion, is the estimated amount currently expended per year for base pay (including overtime) plus pension funding. The second figure, $25.2 billion, shows how much that amount will increase if CalPERS lowers their pension fund return on investment projection from 7.75% to 5.75%. The third figure, $17.4 billion, is how much base pay and pension funding for public safety employees would cost taxpayers in California if their base pay and pension benefits had merely kept pace with inflation, instead of escalating at a rate between 19% (correctional officers), 28% (police officers), or 33% (firefighters) greater than the past decade’s inflation. Finally, the fourth figure, $16.2 billion, shows how much taxpayers would pay to fund public safety base pay and benefits in California if, instead of increasing their pay and benefits during a period when everyone else was getting paid less, they took 7% cuts to their pay and benefits – i.e., did not see their income rise quite as fast as the rate of inflation.

Between 2000 and 2010, not only public safety personnel, but all state and local employees in California saw increases to their pay and benefits that exceeded the rate of inflation. The reasons for the decline in real income in the private sector are many and complex; globalization, increased productivity and overcapacity, the obsolescence of middle-management and skilled jobs – lost to office automation and robotic manufacturing – unsustainable and maxed debt accumulation, over-regulation, under-regulation, and of course, insufficiently progressive taxation and insufficient taxes on wealthy individuals and corporations – or is it the lack of a universal flat tax and excessive taxes on everyone? It depends on who you ask. But for the five million households in California who do pay taxes, it is fair to wonder what level of compensation is equitable for public safety personnel, and why their compensation has increased by double-digits (after inflation) during a time when private sector incomes have gone down.

Special Interests vs. Fiscal Reform

It is impossible to easily summarize all of the efforts government worker unions have mounted in California to consolidate their power. But the efforts by these unions to disrupt reform initiative efforts, as well as undermine the initiative process itself, is worthy of special mention, and is the focus of this post.

As Californians realize that unions stand firmly opposed to reducing government worker pay and benefits as one way to reduce government deficits, and further realize that their elected officials are controlled by these unions and unable to enact reforms, the citizens initiative has become their tool of last resort. Across the state, grassroots organizations have mounted initiatives designed to reduce government expenditures – through banning Project Labor Agreements, or right-sizing government worker pensions, or through campaign finance reforms that target unions alongside large corporations. These measures constitute a profound threat to government union power.

Here are some of the ways government worker unions have spent millions of dollars over the past six months to fight reform through the initiative process:

MISINFORMATION TO THEIR OWN MEMBERSHIP:
In mid-July the SEIU created a “think before you ink” flyer filled with misinformation and distortions regarding a major threat to their power, the “Stop Special Interests” initiative that would ban corporations or unions from withholding money from paychecks to finance political activity. The flyer claims, for example, that “business donates more to politics than unions by a ratio of 15-1.” Actually in California the unions spend more than business on politics, especially at the local level. It further claims that the Stop Special Interests initiative is funded by “out of state billionaires,” yet not one out of state donation had been received according to this campaign’s June 30th financial statement posted on the California Secretary of State’s website. And finally, the flyer claims that the Stop Special Interests initiative will “deny our membership the ability to voluntarily contribute to politics.” If you read the initiative, however, actually it will require voluntary contributions. Currently these political contributions are, if not forced, assessments that require a laborious “opt-out” process to avoid workers making payments to the unions via automatic deductions their paychecks.

ORGANIZED EFFORT TO INTIMIDATE PETITION GATHERERS AND SIGNERS:
In mid-July, the LA County Federation of Labor AFL-CIO, and the SEIU Local 1000 in Sacramento, along with others, created an 800 number for people to call and report signature gathering in process. Observers reported the unions were paying homeless people in LA and San Diego to do this. Then the unions would send a “truth squad” to block the signature table and intimidate both signers and gatherers. Sources at signature gathering firms reported that the harassment from these “blockers” has never been this organized or intense.

SEVERAL PIECES OF LEGISLATION DESIGNED TO UNDERMINE THE INITIATIVE PROCESS:
This year the unions have pushed at least four pieces of legislation to curb the initiative process:

ACA 6 – Prevents passage of initiatives that reduce tax revenues. According to bill sponsor Assemblyman Mike Gatto, ACA 6 “will require initiatives that spend money or create a new program or mandate to identify and specify the funding to pay for it.” The practical effect of this bill, which would require language in any initiative specifying a new source of tax revenue for any costs attendant to enforcing the initiative in excess of $5.0 million, would be to only allow initiatives onto the ballot that raised taxes. This law would leave the decision regarding the financial impact of a proposed initiative in the hands of the State Dept. of Finance, where they could anoint bills they favored, and subject the ones they don’t like to a slanted financial analysis, or, worse, delayed indefinitely in the limbo of an ongoing analysis. Still active.

SB 448 – Forces circulators of initiative petitions to wear a button that tells whether they are paid or volunteer. Sponsored by Sen. Mark DeSaulnier, SB 448 would require that people who collect signatures wear signs around their necks announcing whether they are a paid signature-gatherer or a volunteer signature-gatherer, and whether they are registered to vote. Vetoed by Gov. Brown.

SB 168 – Bans ballot committees and individuals from paying people who circulate petitions for initiatives, referendums and recalls on the basis of the number of signatures they collect. Instead of paying signature gatherers based on their productivity, these workers would be required to receive an hourly wage. Equally troubling, they would be required to be hired as full time employees – an utterly impractical approach to what is seasonal, temporary work. The practical effect of this law will be to double or triple the cost of putting an initiative onto the ballot, which drives out the grassroots organizations but leaves intact the prerogatives of powerful special interests. Vetoed by Gov. Brown.

ACA 10 – Would allow the Legislature to amend or repeal voter-initiated statutes after they have been in effect for four years. Again, the practical effect of this would be to force grassroots taxfighting organizations back into expensive initiative battles every four years, making it very difficult to implement lasting reforms. Still active.

DECEPTIVE STATEWIDE RADIO CAMPAIGN WARNING PETITION SIGNERS AT RISK FOR IDENTITY THEFT:
Beginning in July and running through most of August, they have ran millions in radio ads across the state suggesting that signing a petition puts the signer at risk of identity theft.

POSSIBLE INVOLVEMENT IN MASSIVE NUMBER OF FRAUDULENT PETITION SIGNINGS?
There may be evidence that registered voters opposed to reform initiatives were encouraged to sign petitions multiple times in an attempt to disrupt the gathering of a sufficient number of verified individual signatures. According to these anonymous sources, in LA County, in random checks, petitions were signed by the same person four and even five times. According to anonymous sources elsewhere in California,  sets of petitions were found that had been signed by the same person as many as fifteen times. To find widespread examples of this during internal verification, is, if not the result of an organized effort to defraud the process with duplicates, something nearly impossible to occur randomly.

AGGRESSIVE HARASSMENT OF PETITION GATHERERS:
San Diego has had particularly bad experiences with aggressive union blocking efforts. The YouTube link references a 2 hour upcoming (Sept. 15) prime time television expose on the union war against petition gatherers in San Diego. Not included on this video are reports that signature gatherers are being followed home by union operatives after they’re finished working, and being harassed in their own driveways.
http://www.youtube.com/watch?v=yOrULwS_2go

LAST-MINUTE LEGISLATION TO LIMIT STATEWIDE INITIATIVES TO ONCE EVERY TWO YEARS:
This bill, SB 202, was gutted and amended late at night on Sept. 8th, the 2nd to last day of the legislative session for 2011. In its new form, it will prohibit initiatives from being on any statewide ballot other than November of every even numbered year. It appears to be a direct response to this – the Stop Special Interest Money Act – a statewide reform initiative for which the proponents are on the verge of completing signature gathering and filing for appearance on the June 2012 ballot. Governor Brown has 30 days to either sign or veto this.

What is especially disappointing about these efforts is that they are disrupting the ability of voters to even have a choice. Targeting the initiative process is an attack on one of California’s most resilient institutions, direct democracy. And it is quite ironic that these government worker unions characterize the grassroots organizations who are fighting desperately, with extremely limited funds, as backed by “billionaires and big corporations.” The money, as well as the institutional power, is clearly on the side of these government worker unions, since in these many counterattacks they clearly have spent many times what the reformers have managed to spend.

The Impact of Tax Exempt Pensions

It is surprisingly difficult to gather data on just how many public safety employees claim disability in their retirements, but this should not prevent us from estimating what the benefits bestowed on disability claimants cost taxpayers.

A common program to compensate public safety workers for job-related disabilities is to grant them a tax exemption, whereby 50% of their retirement pension is exempt from state and federal taxes. While it is virtually impossible to collect data from pension fund administrators on exactly how many retired public safety workers have retired with this benefit, a 2004 investigative report by the Sacramento Bee found that among retired members of the California Highway Patrol, 66% of the rank and file officers, and 82% of the chiefs retired with service disabilities. Similarly, a 2006 investigative report by the San Jose Mercury found that two-thirds of San Jose Firefighters retired with service disabilities. Neither of these reports remain available online, although a Google search on the term “Chief’s Disease” (a term coined by the Sacramento Bee) will find dozens of secondary references to these studies; you can start here, and here.

The point of this analysis, other than to point out the shocking lack of comprehensive data on this issue, is to perform a what-if, based on assumptions that might be reasonably extrapolated from the available data.

The first section of the table below, “Impact per Worker,” shows what a person receiving a service disability tax exemption is really making annually, based on normalizing the take-home, after-tax earnings between the case with a 50% tax exemption vs. one with no tax exemption. Column one shows an average annual pension for a recently retired California public safety employee – probably low – of $75,000 per year. It then shows what their tax burden would be based on 50% of that income being exempt from taxes – leaving a taxable income of only $37,500, which invokes far lower withholding percentages. As can be seen, someone with a gross income of $75K per year who only pays taxes on $37.5K will have an after-tax income of $67,999 per year.

Still examining the “Impact per Worker” section of the table below, column two shows that in order to collect an after tax income of $67,999 per year, if one pays taxes on 100% of their income, would require an income of $90K per year, a 20% increase in gross income. This is the true value of the service disability 50% tax exemption. As retirement incomes increase, the disparity actually widens, because the tax brackets invoke higher withholding percentages. For example, a pension income of $100K – quite common among retired public safety workers – paying income taxes on only $50K, would deliver a take-home, after-tax income of $88,858. To earn this much while paying normal taxes without special exemptions would require an annual income of $128,363, a 28% increase. The reader is invited to verify these figures by referring to 2011 Federal Income Tax Brackets, and 2011 California Income Tax Brackets.

The second half of the above table, “Impact for California Taxpayers,” attempts to quantify what the prolific granting of service disability tax exemptions to retired public safety workers costs taxpayers. Based on updated 2010 data from the U.S. Census Bureau for California State Worker Payroll and California Local Government Worker Payroll, there were 222,898 full-time police, firefighters, and correctional officers working at the state and local level in California in March 2010. This amount does not include “full-time equivalents” who brought the total up to nearly 230,000 employees. On average, these full-time public safety workers earned $84,929 per year. Among firefighters, the average was $113,057 per year. Because public safety workers have life-expectancies that – according to CalPERS own actuarial data – meet or exceed national averages, and because they are eligible for retirement at age 50 (in some cases earlier), the calculations on the above table assume we are on track to have one retired public safety worker for every active public safety worker.

As can be seen, based on these assumptions – and the pension estimate of $75K per year is almost certainly quite a bit lower than the reality, since the average mid-career earnings of public safety workers is currently $85,000 per year, and pensions are calculated on end-of-career earnings – if 50% of public safety workers retire on service disability tax exemptions, the cost to California’s taxpayers is $1.7 billion per year.

Whether or not this is an accurate estimate, and available data suggests that this estimate is, if anything, on the low side, is almost beside the point. Where is this data? Why doesn’t CalPERS, and the other pension funds managing public safety employee retirement assets, release this data?

Nobody seriously questions that public safety workers deserve to make a premium for the work they do. The level of sophistication required to work in law enforcement and fire suppression today is far greater than it was 20 or 30 years ago. The value we place on life and personal security is also greater today than ever before. There is a price for this, and it is one taxpayers should pay without resentment. The question is how much of a premium is equitable, and how much of a premium is financially sustainable. A related question is how much of this premium paid to public safety workers, to the extent it is excessive, the result of powerful government worker unions who pool taxpayer’s money to control local elections with massive campaign contributions. How much is this pay premium elevated because public safety worker unions, and their PR firms, exploited their deserved hero status in inappropriate ways to manipulate the electorate to ignore fiscal reality?

When the question turns to pensions, however, the issue of whether or not a premium is appropriate for service in public safety may not be as justifiable. If public safety workers deserve a premium, it should be paid as part of their current compensation. This way they may share, along with all public employees, the same obligations to financially prepare for their retirement that face working private sector taxpayers. As for disability pensions, it strains credulity to think that over 80% of police chiefs and fire captains, and over 60% of other public safety workers are disabled in the course of their jobs. And even if they are, these disabilities can be remedied through far less expensive private disability insurance, not through the granting of service disability tax exemptions that increase the effective gross amount of their pensions by 20-30%.

Questioning whether or not we should offer pensions in excess of $75K per year to workers who retire in their early 50s, or then offer as many as half of these retirees with service disability tax exemptions, goes beyond questions of financial sustainability. It goes beyond questioning how much of a premium they deserve for the risks they take to protect the public. A deeper question is not how much we value the lives of those who protect us, but how much we value everyone’s life. Dozens of jobs are more dangerous than those in public safety. Logging, fishing, agriculture, and mining occupations claim thousands of lives every year, and maim thousands more. Few if any of these workers retire in their early 50s with pensions of $75K or more, and none of them receive service disability tax exemptions. Do we consume the products that these workers lose their lives and endure disabling injuries to provide for us? Can we live without those products? Are their lives any less significant than the lives of others who wear badges? For that matter, are the millions who toil in factories or in front of computers any less likely to wear out and become disabled through repetitive motions and eye strain? Are their injuries less debilitating? Is their life’s work undeserving of commensurate dignity?

Ultimately, we all share the fate of our mortality, the ultimate disability. We age, we wear out, we are progressively disabled, and then we die. Nobody escapes this verdict, whether our professions are public or private, intellectual or physical, noble or profane. This common denominator – tempered by considerations of what is financially realistic – should govern our common response to the challenges of disabilities, not privilege, nor political power, nor manipulative emotional appeals.