Time for California’s Unions to Get Serious About Pension Reform

There was a time, long long ago, when California’s pension systems were responsibly managed. They made conservative investments, they paid modest but fair benefits to retirees, and they didn’t place an unreasonable financial burden on taxpayers. But a series of decisions and circumstances over the past thirty years put these pension systems on a collision course with financial disaster. And like hybrid war, or creeping fascism, or a progressive, initially asymptomatic disease, it is impossible to say exactly when these pension systems crossed the line from health to sickness.

An excellent history of how California’s public employee pension systems moved inexorably towards the predicament they’re now in can be found in a City Journal article entitled “The Pension Fund That Ate California.” Written in 2013, when California’s pension systems were still coping with the impact of the Great Recession, author Steven Malanga identifies key milestones: The power of public sector unions that began to make itself felt starting in the late 1960s. The pension benefit enhancements that began in the 1970s. The growing power of the union representatives on the pension fund boards. Prop. 21, passed in 1984, which allowed the pension systems to invest in riskier asset classes.

The biggest milestone on the road to sickness, however, began in 1999, as Malanga writes, “when union-backed Gray Davis became governor and union-backed Phil Angelides became state treasurer, and the CalPERS board was wearing a union label.” The state legislation that followed, mimicked by local measures across California, dramatically increased pension benefit formulas. Not only were benefits increased, but they were increased retroactively, meaning that even state and local employees nearing retirement would receive the increased pension as if these higher benefit formulas had been in effect for their entire career. And as the internet bubble blew deliriously bigger, the experts said the cost for all these enhancements would be negligible.

In the aftermath of the internet bubble’s inevitable pop in 2000, pension systems engaged in accounting gimmicks and deceptive proposals to assist the unions to roll out these benefit increases to nearly every city and county in California.

This would be an early example of how government unions and financial special interests saw an alignment of their political agendas, but it wouldn’t be the last. As payments to the pension plans inexorably increased, year after year, unions found common cause with the financial sector to market tax increases and bond measures. Every election, in lockstep, they would fight to convince the taxpayer to pay more and borrow more – and it was always for the children, for the elderly, but in reality, it was usually for the pensions.

The Burden of Public Sector Pensions on California’s Taxpayers

The complexity of pension finance makes it relatively easy to obfuscate the problem with creative accounting and emotional arguments. But certain facts can help to put the issue in perspective. Before the current financial crisis began, California’s state and local public sector pensions were estimated to rise from approximately $30 billion per year to $60 billion per year by 2025. Currently, California’s total state and local government general revenues are around $500 billion per year, meaning that pension payments are already set to consume over 10 percent of ALL state and local government revenue.

This ten percent doesn’t include the cost of retirement health insurance benefits, nor the cost for Social Security which many of California’s public employees also enjoy. It also doesn’t include the tens of billions spent every year by taxpayers to pay overtime, based on the fact that paying overtime is actually less expensive than paying for another government employee who will require another pension benefit package.

The pension burden, however, is about to get much bigger.

With most pension reform stopped in its tracks by relentless litigation, perhaps the only way pensions can ever be reformed will be through economic necessity. If so, now would be a good time. A perfect storm has struck. Here are highlights:

1 – The stock market has crashed. Interest rates are at zero, meaning it is unlikely investments in bonds will see continued appreciation. Real estate may also be at a peak, and in any case, real estate investment appreciation cannot make up for losses in stocks and bonds.

2 – Government revenues are going down for various reasons. California’s state government relies heavily on receipts from high income individuals, and those individuals rely on stock appreciation. These revenues always fall in a downturn, and this effect will ripple into every California city and county. Also, sales tax revenues, which local governments rely on, will dramatically fall over the coming few months.

3 – Californians for the first time in several election cycles have rejected local measures to fund taxes and bonds. Normally, at least two out of three new local tax or bond are measures are approved by California voters. This time, in March 2020, those proportions were surprisingly reversed, with about two out of three failing to get voter approval. This means new revenues these localities were counting on will not materialize.

A closer look at CalPERS will reveal just how dramatic the problem has finally become:

In their 6/30/2019 financial statements, CalPERS, the largest pension system in the U.S., reported themselves to be only 70.2 percent funded. To cope, the system was requiring its participating agencies to nearly double their annual payments by 2025. Needless to say, these increases were going to create havoc on civic budgets that already can barely afford to pay for their pensions.

That was then.

As of March 20th, the market value of all investments managed by CalPERS had fallen to $333.8 billion, after topping a record $400 billion just one month earlier. The most recent officially reported estimate of the total liability carried by the CalPERS system is $505 billion as of 6/30/208 (ref. most recent CalPERS CAFr, page 122). If you review the trends over the past decade, this figure has never gone down. This means, best case, as of today, CalPERS is 66.9 percent funded. The real number is almost certainly lower.

As of March 20, for example, the Dow Jones Index closed at 19,161. At close on 3/23, the Dow is down to 18,591, down another 3.1 percent. At this time, the only thing that is certain is uncertainty.

Pension Solvency Will Require Union Cooperation

If there’s one thing that history has shown, it’s that nothing gets done in California without the blessing of the public sector unions. One may argue on principle that unionized government is an abomination, having little or nothing in common with private sector unions which – properly regulated – have a vital role to play in American life.

But so what? California’s state and local governments have been taken over by these unions, who operate as senior partners to leftist billionaires, trial lawyers, race-baiting rent seekers, and environmentalist fanatics. For the most part, financial and corporate special interests are complete sell-outs to these all powerful unions, or survive via precarious detente.

Fixing pensions in California, with union cooperation, would be relatively easy. With union cooperation, politicians would have a chance to enact reforms that would not get mired in endless litigation. With union cooperation, government workers – and the public – would be able to learn about the extent of the problem instead of getting dosed with emotional propaganda. Possible solutions could be far reaching and inspiring. Here are some ideas:

1 – Reduce all pension benefit accruals to pre-1999 levels for all future work. Leave intact benefits earned to-date.

2 – Lower the long-term rate of return projection for pension assets to 6 percent.

3 – Lower the inflation stop-loss for retirees from the current 70-80 percent to 50-60 percent – provide for COLA reductions if economy encounters deflation.

4 – Raise the age of eligibility to 62 for all employees, with full benefits only available to miscellaneous employees at age 67 (same as Social Security).

5 – Implement additional “triggers” that take effect if funding falls below 80 percent, including suspension of COLA, prospective further lowering of the annual multiplier for active workers, retroactive lowering of the annual multiplier for active workers, reduction of the retiree pension payment, increase the required payment to the pension plan by active workers via withholding.

The pension systems themselves could assist this process greatly if they simply provided analysis of what measures 1 and 2 would accomplish. Lowering the rate of pension benefit accruals for future work will permit lowering the long term rate of return projection without increasing the total liability. If the pension system analysts could provide a table expressing that curve, it would greatly assist policymakers and reformers, including the union leadership.

Unfortunately, pension actuaries and fund managers do not have an illustrious track record in these exercises, so, again, it would be useful if the union leadership itself would insist on a quick turnaround and an honest, depoliticized assessment.

And what if, from now on, public employees earned lower pension benefits? First of all, it would take an awful lot before those benefits descended to the level of what the rest of California’s workforce can expect from Social Security.

An independent contractor in California has 12.4 percent withheld by the Social Security Trust Fund, and for that, they may expect a maximum of $36,132 after over 40 years of work; the average is $18,036. In 2015, the average pension for a California public employee after only 30 years of work was $68,673, not including any benefits. It is surely higher now.

What public sector union leadership might contemplate is how can the prospects for all workers in California improve. Now, with the economy grinding nearly to a halt, it is an especially good time for this sort of contemplation. Why not require CalPERS to invest 50 percent of their assets in “California based companies and projects” instead of the current 9.1 percent (ref. CalPERS CAFR, intro page 4)?

The idea that CalPERS and other pension funds were ever helping California’s economy is a blatant falsehood. The numbers are irrefutable. In 2018 CalPERS collected $28.7 billion, but only paid out 26.9 billion (CalPERS CAFR, pages 42 and 43). Since $3.5 billion of those payments were made to retirees living out of state, only $23.4 billion stayed in California. This means that Californians gave CalPERS $5.3 billion more than retirees living in California received in pension benefits. Meanwhile, over 90 percent of CalPERS investments are made outside of California.

What if public sector union leadership decided to fight for all California workers, by supporting reform of the California Environmental Quality Act, which would permit cities and suburbs to expand their borders onto open land again, greatly lowering housing costs? What if these unions supported pension fund investments in revenue bonds and equity positions to build new freeways, water storage projects, and cheap energy infrastructure? Imagine how much could be built if literally hundreds of billions of pension fund assets were invested right here in California!

There is a new consensus that could form in California, excluding the libertarian fanatics who think the only criteria for a pension fund investment is the return, even if it requires investing in Chinese slave shops. This new consensus could also exclude the identity-politics demagogues whose only criteria for a proper investment is the “diversity” of the workforce, the directorships, and the communities affected.

Who knows, maybe a new consensus could even knock the environmentalist fanatics – along with their trial lawyer and crony “capitalist” allies – down to size, allowing “green” investment criteria to resume its appropriate place within a kaleidoscope of worthy considerations.

If all these things were done, California’s cost-of-living would go down, meaning public sector retirees could enjoy the same standard of living as before, even if they retired with somewhat lower pensions. Moreover, the economy would be sizzling again, pouring record tax revenues into a solvent public sector.

The win-win envisioned here is no more preposterous than the notion of 7.25 percent pension fund returns for the next thirty years, and far more beneficial for everyone living in California instead of just beneficial for public servants.

This could be a time for a consensus that wipes away extremes, which might make CalPERS and the other pension systems a benefit to California’s economy instead of a terrifying drain. Public sector unions; the ball is in your court.

This article originally appeared on the website California Globe.

 *   *   *

How Much Water Went Into Growing the Food We Eat?

The rains bypassed sunny California in January and February 2020, encouraging talk of another drought. California’s last drought was only declared over a year ago, after two wet winters in a row filled the states reservoirs. To cope with the last drought, instead of building more reservoirs and taking other measures to increase the supply of water, California’s policymakers imposed permanent rationing.

This predictable response ignores obvious solutions. Millions of acre feet of storm runoff can not only be stored in new reservoirs, but in underground aquifers with massive unused capacity. Additional millions of acre feet can be recovered by treating and reusing wastewater, and by joining the rest of the developed nations living in arid climates who have turned to large scale desalination.

All of this, however, would require a change in philosophy from one of micromanagement of demand to one that emphasizes increasing supply. To understand why a focus on increasing supply is vastly preferable to reducing demand, it helps to know just how much water California’s urban residents consume compared to other users.

As a matter of fact, the average California household purchases a relatively trivial amount of water from their utility, when compared to how much water they purchase in the form of the food they eat. For this reason, reducing residential water consumption will not make much of a difference when it comes to mitigating the effects of a prolonged drought.

To illustrate this point, it is necessary to determine just how much water is available to Californians, and how much of that water is being consumed by residential households in California. When making this analysis, one must not only estimate how much water California’s households purchase from their utility, but how much water is embodied in the food they eat.

Total Annual Water Supply and Usage in California

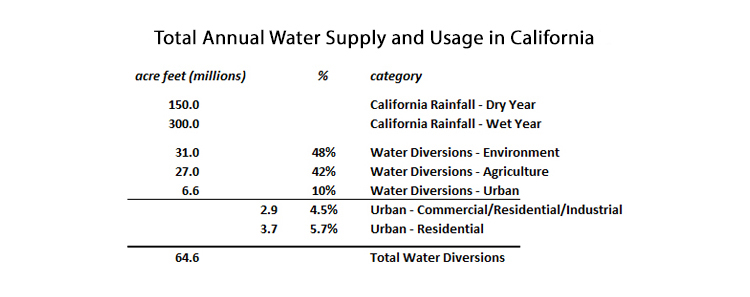
Here’s a rough summary of California’s annual water use. In a dry year, around 150 million acre feet (MAF) fall onto California’s watersheds in the form of rain or snow, in a wet year, Californians get about twice that much. Most of that water either evaporates, percolates, or eventually runs into the ocean. In terms of net water withdrawals, each year around 31 MAF are diverted for the environment, such as to guarantee fresh water inflow into the delta, 27 MAF are diverted for agriculture, and 6.6 MAF are diverted for urban use. Of the 6.6 MAF that is diverted for urban use, 3.7 MAF is used by residential customers, and the rest is used by industrial, commercial and government customers.

Put another way, Californians divert 65 million acre feet of water each year for environmental, agricultural and urban uses, and the planned permanent 25% reduction in water usage by residential customers will only save 0.9 million acre feet per year – or 1.4% of total statewide water usage. One good storm easily dumps ten times as much water onto California’s watersheds as would be saved via a 25% reduction in annual residential water consumption.Armed with these facts, there’s a strong argument that cutting back on residential water consumption will not make a significant difference in California’s overall water use. There are additional facts that can put this argument into an even sharper context: How much water do California’s households consume in terms of the water that was required to grow the food they eat, and how does that amount compare to the water they purchase from their utility for indoor/outdoor use?

The “Water Footprint” of Food per Ounce and per Calorie

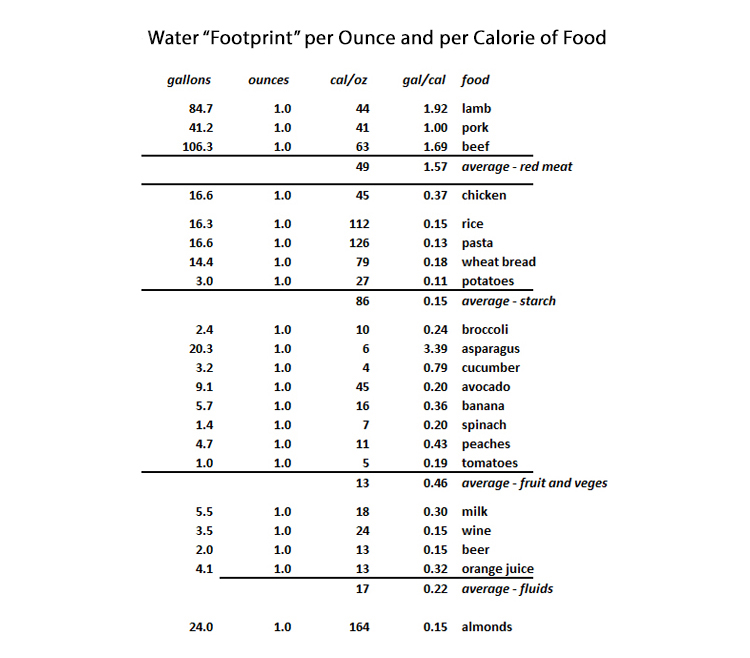
While the information to determine this is readily available, it isn’t typically compiled in this context, so here goes. The best source of comprehensive data on the “water footprint” for various types of food comes from the Water Footprint Network, a project initially funded by UNESCO. An excellent distillation of that information was produced in April 2015 by Kyle Kim, John Schleuss, and Priya Krishnakumar, writing for the Los Angeles Times. Information on calories per ounce was found on the website “fatsecret.com.” Information from these various sources is summarized on the following table.

As can be seen on the above chart, when evaluating the water efficiency of various food sources, it is misleading to rely only on gallons per ounce, since the number of calories per ounce are highly variable. But putting these two variables together to calculate a gallons per calorie measurement is quite useful. Clearly, meat products require a huge amount of water per calorie. The most efficient sources of meat protein are found in chicken, which at 0.37 gallons per calorie is around four times as water-efficient as red meat. Some sources of protein from vegetables are surprisingly efficient, including avocados at 0.20 gallons per calorie, and the almond – much maligned as a water waster – at 0.15 gallons per calorie. But we digress.

How much water does it take to feed the average household in California, and how does that compare to the amount of water they buy from the utility for indoor/outdoor use?

Total Annual Consumption of Water-in-Food per Household

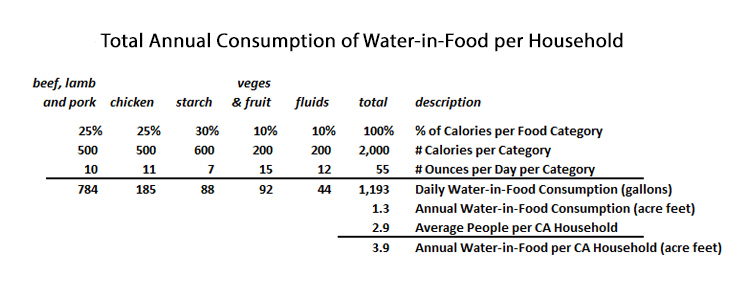
The next table, below, provides this estimate based on a typical diet. The estimate of 2,000 calories necessary to sustain the average human (men, women, children) comes from WebMD. The breakout of food consumption by category, while somewhat arbitrary, relies on data on “the average American diet“c ompiled by researcher Mike Barrett, writing for the Natural Society website. In turn, Barrett relied on USDA and other government sources for most of his data, which is reflected here.To summarize, in one year, the average American consumes a quantity of food that required 1.3 acre feet of water to grow. In turn, at 2.91 people per household in California, the average household consumes a quantity of food per year that requires 3.9 acre feet of water to grow.

Average Annual Water Use per California Household

Putting all of this together yields a revealing table, below, that shows that the average California household purchases a relatively trivial amount of water from their utility, when compared to how much water they purchase in the form of the food they eat. By dividing the 3.7 million acre feet of water used by residences each year in California by the 12.8 million households in California, the average annual water consumption per household is 0.289 acre feet. By contrast, the amount of water that is eaten, so to speak, by the average California household is 3.9 acre feet, thirteen and a half times as much.

By the way, it is irresistible to point out that drinking water, that quantity each human requires for their daily hydration, based on the 0.5 gallon per day recommendation from the Mayo Clinic, comes out to a paltry 0.0016 acre feet per year per household – not even a rounding error when compared to the other uses. Think about that the next time you have to ask for your water at a California restaurant.There is no Reason Water Cannot be Abundant and Affordable

For decades, when it comes to water, California’s policymakers have prioritized demand restrictions instead of supply enhancements. This is consistent with their priorities in other critical areas, certainly including energy and transportation. “Induced demand,” the idea that if you build it, more will use it, is the nightmare axiom that governs this policy. It certainly would never have to do with the possibility they’d rather put all those operating funds into their pay and pensions instead of expanding public infrastructure.

The problem with this, however, is that eventually the conservation option begins to yield diminishing returns, and then all you have left is punitive rationing. And once via punitive rationing you have wrung all of the redundancy and surplus out of the system, you have no resiliency if any part of the system fails. That is where California is today. The abundance choice is the only viable option if Californians are to improve their quality of life. In no particular order, here are some reality checks that California’s voters and elected officials ought to consider:

(1)  Projects that increase water supply via sewage reuse, runoff storage via reservoirs or aquifers, and desalination, are options that benefit all users, urban and agricultural.

(2)  Increasing the supply of water from diverse sources creates system resiliency which can be of critical benefit not only in the face of persistent drought, but also against catastrophes that may, for example, disable a pumping station on a major aqueduct.

(3)  The energy costs to desalinate seawater, approximately 4.0 kilowatt-hours per cubic meter, are overstated. Desalination plants can be co-located with power plants, eliminating power loss through transmission lines, whereas far-flung pumping stations consume significant amounts of electricity. Depending on transmission loss and desalination plant efficiency, the amount of lift beyond which desalination consumes less power than pumping is only about 1,500 feet.

(4)  Public investment in water saving home appliances, for example via tax rebates to consumers to purchase them, by contrast, do not increase the overall supply of water.

(5)  It is nearly impossible to engage in excessive use of indoor water in a household, because 100% of the sewage is treated and released as clean outfall to the environment. Moreover, sewage is increasingly treated and reused as potable water, and eventually 100% of indoor water waste will be cycled immediately back for reuse by households.

(6)  One preferred way to reuse household sewage is referred to as “indirect potable reuse,” where the treated water is percolated into aquifers where it is eventually pumped back for household reuse. This practice has the virtue of banking the water against supply disruptions, recharging the aquifer which is especially beneficial in coastal areas where there can be salt water intrusion, and even, as water is repeatedly cycled through the aquifer, causing an ongoing improvement to the quality of the water in the aquifer as treatment progressively reduces levels of undesirable residual toxins.

(7)  While achieving 100% reuse of sewage will render indoor water conservation pointless, the virtues of outdoor water use are understated. Healthy landscaping, consisting of abundant vegetation including lawns, reduce the incidence of dust-borne pathogens, reduce the incidence of asthma, and clean and moisturize the air. Replacing grass playing fields with artificial turf introduces toxins, causes more ACL and other sports injuries, and retains heat – often to the point of making these faux fields unplayable unless they are, ironically, watered.

(8)  Simply giving up consumption of red meat would reduce the average household’s water consumption by nearly 2.0 acre feet per year. By comparison, the average Californian household’s total water consumption from the utility averages 0.29 acre feet per year. That is, just replacing consumption of red meat with an equivalent caloric intake of chicken will save the average household seven times as much water as they buy from the utility for all uses, indoor and outdoor.

Policies designed to reduce household water use are a good idea, but must be kept in perspective. What has already been done is more than enough, and priorities now must shift towards investment in infrastructure to increase the supply of water. Nearly all water diversions in California, about 90%, are either to preserve ecosystem health or to supply agriculture. Indoor water overuse is becoming a myth, and will become entirely irrelevant as soon as 100% sewage reuse capacities are achieved. Outdoor water use should not be thoughtless, but allowing grass and perennials to die, or converting landscaping to “desert foliage,” is a cultural shift that is not necessary or desirable.

Along with investing in infrastructure to increase the supply of water, public education to help Californians adopt healthier diets would have the significant side benefit of being sound water policy. A trivial change in patterns of food consumption yields a major reduction in water required for food. For example, a public education campaign that caused a voluntary 10% reduction in red meat consumption (from 25.0% of all calories to 22.5% of all calories) would reduce California’s water consumption by 2.5 million acre feet per year. By comparison, total outdoor residential water consumption in California is estimated at only 1.8 million acre feet per year.

Perhaps, in lieu of renouncing escalating and entirely unnecessary mandates to reduce household water use, those of us who love our lawns might at least be granted a waiver if we were to present an annual affidavit to document our below-average consumption of red meat. Our smart refrigerators might actually submit the report to the utility, sparing us the paperwork.

This article originally appeared on the website American Greatness.

 *   *   *

California Cities in Critical Condition

The specter of California’s cities and counties becoming insolvent is nothing new. Three major California cities have already declared bankruptcy, Vallejo in 2008, Stockton and San Bernardino in 2012. In October 2019, the California State Auditor’s Office reported on the fiscal health of 471 California cities.

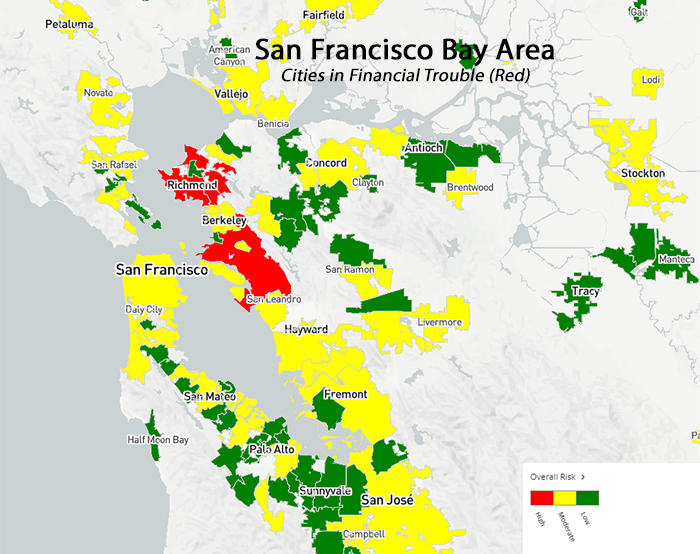
On what the California State Auditor’s office describes as a “Local Government High Risk Dashboard,” they identified 18 high risk communities: Compton, Atwater, Blythe, Lindsay, Calexico, San Fernando, El Cerrito, San Gabriel, Maywood, Monrovia, Vernon, Richmond, Oakland, Ione, Del Rey Oaks, Marysville, West Covina, and La Habra.

This so-called “dashboard” includes data for all the 471 cities on financial variables such as liquidity, debt, reserves, pensions and other retirement benefits. It also provides an excellent map. On this zoomed in segment, the financially troubled cities of (from north to south) Richmond and El Cerrito (contiguous), and Oakland can be seen highlighted in red.

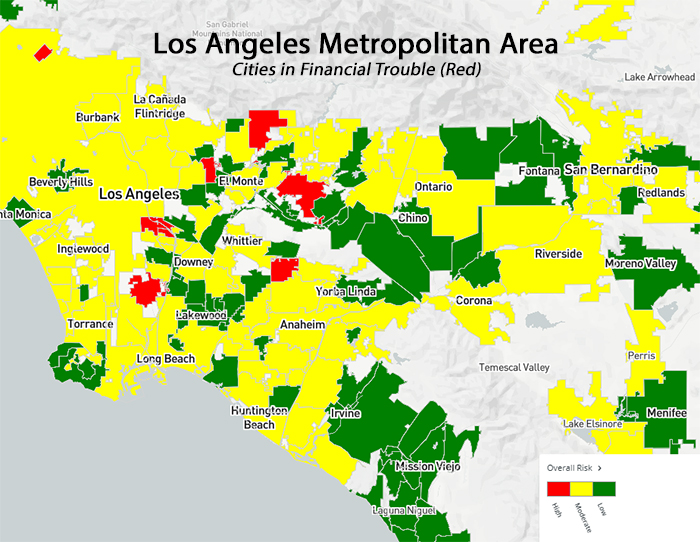
Southern California also has its share of financially troubled cities, as shown on the next map segment taken from the California State Auditor’s dashboard. Clockwise, starting from the top, the most financially endangered cities are Monrovia, West Covina, La Habra, Compton, Vernon and Commerce (contiguous), and San Gabriel.

Back in October 2019 when the California State Auditor warned Californians about 18 cities in immediate financial peril, the overall economic situation looked very different than it does today. And at that time, articles that reported on the auditor’s warning published by Reason, Governing, and Associated Press all pointed to underfunded pensions as a primary cause of their financial distress.

Not long ago, but still prior to the events of the past few weeks, during a hearing in the California State Assembly on February 26, the California State Auditor requested authorization to conduct in-depth audits of the financial health of five California cities, Blythe, El Cerrito, Lindsay, San Gabriel, and West Covina.

The one financial threat that was mentioned in all five of the California State Auditor’s requests was pensions.

“Blythe has incurred substantial debt and increasing liabilities pertaining to its city employee retirement costs, which could result in the city needing to divert more of its general fund resources to cover these costs in lieu of providing essential public services.”

“El Cerrito has not developed a long-term approach to improve its financial condition and has not addressed its increasing pension costs.”

“Lindsay anticipates its pension and other post-employment benefit costs to at least double by fiscal year 2025-26.”

“My office identified San Gabriel as the eighth most fiscally challenged city in California primarily because it has insufficient cash and financial reserves to pay its ongoing bills and it faces challenges in paying for employee retirement benefits.”

“West Covina’s unfunded pension liability is very high compared to its annual revenues, and it has only set aside a portion of the funding it will need to pay for the pension benefits already earned by its employees. Its growing pension costs will also put additional pressure on its finances.”

The Market Correction Will Affect More Than Pension Payments

It’s interesting to wonder why California’s State Auditor selected five relatively small cities for the scrutiny of a state audit. The most troubled of the five, Blythe, was number three on the auditor’s ranking by overall financial risk, behind Compton and Atwater. The City of West Covina was number 17. So why not big cities? Why not Oakland, ranked number 13, or San Jose, ranked number 23, or big Los Angeles, ranked number 32? When the denominator is 471, being ranked 32 is not good – that puts Los Angeles in the worst seven percent.

But now what? Now that the economy is slowing, and the value of investments are correcting dramatically downward?

No matter what position one may take on the financial wisdom of offering defined benefit pension plans to public employees, one point needs to be reiterated at a time like this: While it is true that an 80 percent funded status is considered adequate for a pension fund, it refers to an average across the business cycle. It does not represent what should be necessary at the end of a bull market. California’s public employee pension funds, a few weeks ago and at what we now know was the end of an 11 year bull market, were only about 70 percent funded.

This cannot be stressed enough, because it puts into proper perspective what has to be faced today. A healthy pension system at the end of over a decade of extraordinary investment returns should be overfunded. Perhaps it is credible to be sanguine about falling a bit short of the 80 percent threshold after ten years of investment doldrums, but it is absurd, and dangerous, to pretend such a level of funding is adequate after ten or more years of spectacular investment gains.

And it isn’t just pensions, anymore, that are going to affect the financial health of cities across California, from San Jose and Oakland in the north down to Los Angeles in the south. The recent and long overdue correction in the stock market was triggered by a global pandemic that is going to paralyze huge segments of the U.S. and global economy for the next several weeks, if not months. This will cause sales tax revenues to crater for as long as “social distancing” mandates remain in place, and afterwards, even an extraordinary rebound is unlikely to make up for the loss.

The impact of investment losses will impact the pension funds in two ways. Obviously they are going to have to require more from taxpayers to cover their losses, and they were already phasing in a near doubling of their required contributions – which California’s cities and counties had no idea how they were going to pay for. But the other impact, lower revenue, will pose a much bigger challenge, affecting the ability of cities and counties to pay for anything, including the pension funds.

Not only will sales tax revenue falter, but state income tax revenues will fall. California’s state government is highly dependent on income tax revenue from the wealthiest Californians. As reported by Cal Matters, “California’s tax system, which relies heavily on the wealthy for state income, is prone to boom-and-bust cycles. While it delivers big returns from the rich whenever Wall Street goes on a bull run, it forces state and local governments to cut services, raise taxes or borrow money in a downturn.”

California’s state and local governments have had over a decade to get their financial house in order. Instead, they have largely ignored the pension problem, with even Gov. Jerry Brown calling the PEPRA reforms of 2014 an inadequate compromise offering only incremental improvements. They have continued to make punitive demands on businesses, increasing taxes and spending at every opportunity. They have enacted regulations that make affordable housing and energy financially impossible for private sector interests to develop. They have emptied the prisons and opened the borders, putting additional stress on public services. They have created a state where one little push will end the good times.

That push has come.

Even the nonreligious may find an apt parable for today’s dilemma in Genesis chapter 41, verses 17 through 33. During good years, you prepare for bad years. Too bad the wisdom of the ages emphatically does not apply in woke California.

This article originally appeared in the California Globe.

 *   *   *

Sustainable Megacities

Modern urban centers around the world now have neighborhoods that house well over 100,000 people per square mile. The Choa Chu Kang district in Singapore, defined by boulevards lined with 10 to 12 story mid-rise residential buildings, has a population density of more than 125,000 people per square mile. The entire borough of Manhattan has an average population density of more than 70,000 people per square mile, with far higher densities in areas of midtown and lower Manhattan.

According to a 2018 report released by the United Nations, today 55 percent of the world’s population lives in urban areas, a proportion that is estimated to increase to 68 percent by 2050. At the same time, the United Nations projects the global population to increase from 7.8 billion today to 9.7 billion by 2050. These projections lead to a surprising calculation: the absolute number of people living in rural areas is expected to decline, from 3.5 billion today to only 3.1 billion in 2050.

What should not be surprising by now is that people around the world, voluntarily and inexorably, are migrating from rural areas to cities. But the corollary effect is relatively unheralded; that around the world, open land is slowly depopulating. For the most part, this is happening absent government coercion. It flies in the face of the conventional wisdom—heard endlessly in the United States—that we are running out of open space. We aren’t.

If we have a sustainability challenge, it is not to preserve open space—not only because the world’s population is already moving into cities faster than the world’s population is increasing, but because the absolute urban footprint on the planet is relatively insignificant.

This reality was explored at great depth in “The Density Delusion,” and can be distilled down to this: If 10 billion people were all to live in four-person households that were each on quarter-acre lots and everyone had an equivalent amount of space allotted for commercial and industrial use, that would equate to a population density of 5,210 people per square mile, and at that density would only consume 3.8 percent of all land area on earth. Actual estimates of worldwide urbanization as of 2018 are only 2.7 percent of global land area excluding Antarctica, and some analysts believe this estimate is grossly overstated.

But not everyone wants to live in a home with a yard that big. Most people would be content living on a smaller lot, and a large proportion of the population prefers to live in homes with no yard at all. Billions of people, for that matter, apparently prefer to live in high-rise apartments. It is not suburban sprawl that constitutes the prevailing sustainability challenge to humanity, it is building megacities that are resilient to environmental and economic threats, and constitute an inviting destination for migrants from rural areas.

Cheap Energy Is Vital 

The consequences of environmentalists making “climate change” their central focus instead of population growth are epic. Two factors, more than anything else, induce people to voluntarily limit the size of their families: prosperity and urbanization. Both of these require cheap and abundant energy.

It is estimated that as of 2020 there are 38 “megacities” on earth, defined as a metropolitan area with over 10 million inhabitants. Of these, only six—Tokyo, Seoul, New York, Los Angeles, Paris, and London—are located within high-income nations. Moreover, nearly all the forecast growth of megacities will be in developing nations, in places like Jakarta, Dhaka, Mumbai, Kolkata, Karachi, Lahore, Lagos, and Kinshasa.

So what innovations being pioneered today will enable megacities in the future to provide a high quality of life, and how will cities of such size and density reduce their vulnerability to economic or physical disruptions?

The biggest variable governing the success or failure of megacities is energy. Abundant, affordable, and reliable energy is not only a nonnegotiable prerequisite for prosperity around the world, but it is also the only way megacities are feasible. Environmentalists typically observe, correctly, that per capita energy consumption is lower in cities, but they ignore the converse—if you make energy too expensive by curtailing the use of fossil fuels, you prevent people from vacating rural areas where they can forage for energy—unsustainable, dirty, and free—by stripping the biosphere.

Global prosperity and peace, glorious destination megacities, abundant water and food, voluntary population stabilization, and plenty of open land for those who still want to live under a big sky—all of this could be just around the corner.

If the energy challenge is addressed realistically, meaning an “all of the above” energy strategy is adopted worldwide, all the other building blocks of megacities can be assembled. But this means that the legal and financial obstacles that are preventing developing nations from exploiting their oil and gas reserves and building nuclear power plants will have to be lifted.

With abundant energy, for example, the challenge of creating water abundance is manageable. This is because for nearly every type of water infrastructure, the biggest single operating cost is energy. Investing in 100 percent reuse of wastewater, augmented by desalination of seawater, offers nearly every megacity on earth the opportunity to never experience water scarcity. Closely related to this is the rapidly maturing technology for indoor agriculture, including high rise agriculture.

Making Cities Self Sufficient Food Producers

Since a megacity, by definition, is an epicenter of human habitation, then by definition, it is also antithetical to the notion of being “off-grid.” But on the other hand, the megacity needs to be as self-sufficient as possible, since having 50,000 or even 100,000 people per square mile means that any resource that needs to be imported, stored, or removed is going to have to be handled in very high volumes.

Energy efficiency, waste management, as well as energy and water harvesting and treatment are technologies that are extremely important to the megacity—along with smart systems to interconnect all of them. Fortunately, water supply and treatment can be synergistic with indoor agriculture.

Indoor urban agriculture makes a lot of sense. It is possible that using hydroponicsaeroponics, and aquaponics, industrial agriculture operations sited within urban areas can produce enough food to feed the inhabitants, reducing the need to import food from farming regions. These facilities would also be able process wastewater from elsewhere on the utility grid—using it to water the plants and to reuse as drinking water.

Here’s how: The grey water extracted from sewage would be subjected to biological and mechanical filtration, then it would be used to water the plants. The plants, in turn, would transpirate heavily in the indoor environment, and dehumidifiers would harvest this water as pristine drinking water, able to be pumped back upstairs or into the utility grid for reuse.

This concept of using transpiration from plants in a commercial high-rise agricultural operation to provide the last mile of greywater purification in the urban environment is revolutionary. Along with the surprisingly low—and dropping—cost of desalination and advances being made in primary sewage treatment, this innovation could help solve the issues of potential water scarcity in the urban environment.

The quantity of food that a high-rise farm might produce is also surprising. Because the plants are grown in optimal conditions—optimized light and water, and no pests—they can yield three to four crops per year instead of one, and each crop may require only a few vertical feet of space. This means each story of high-rise space occupying an area of one acre, for example, could produce several times as much food per year as an acre of ordinary farmland.

This multiple order-of-magnitude increase in potential productivity per unit of land, combined with the proximity to market, means high-rise farming is merely waiting for economic and political conditions to align in its favor. The technology for high-rise farming continues to commercialize and it will be available when we need it to feed the burgeoning megacities of this world.

Building Up, Out, and Down

It is common for the smart growth crowd to say “build up, not out,” but this ignores the fact that building out as well as up increases the overall supply of dwellings, making them more affordable, and reduces the pressure to increase density in suburban areas where the people living there want to preserve their way of life. But what about building down as well?

It isn’t as if building down hasn’t been tried with success already. The New York City subway system. The London Underground. The Paris Metro. What about Boston’s “Big Dig?” Mistakes were made, to put it mildly. But today, anyone who tries to get to Logan Airport from downtown Boston during rush hour will have nothing but good things to say about the much-maligned project. It’s too bad we don’t have more big digs—in the heart of urban centers we could put freeways and rail underground, our cities could reach for the sky, and there would never be traffic jams.

Tunneling on a grand scale may seem mundane, but the industry is rapidly innovating—incorporating new technology across multiple disciplines as fast as it becomes available. From GPS systems that allow a tunneling machine always to know precisely where it is beneath the earth, to better cutting bits, to debris removal conveyances, to mechanical conveyances that simultaneously bring forward shoring material, to worker shelter and control rooms, modern tunneling machines can exceed a mile in length and cost billions to acquire and operate. The global leader in tunneling systems is Herrenknecht AG. An emerging and very disruptive new competitor is Elon Musk’s The Boring Company.

Tunneling, like blasting payloads into low earth orbit, is extremely expensive. But The Boring Company claims tunneling costs can be dramatically reduced. The Boring Company proposes five innovations on its FAQ page: 1) Triple the power output of the tunnel boring machine’s cutting unit; 2) Continuously tunnel instead of alternating between boring and installing supporting walls; 3) Automate the tunnel boring machine, eliminating most human operators; 4) Go electric; 5) Engage in tunneling research and development, “the construction industry is one of the only sectors in our economy that has not improved its productivity in the last 50 years.”

Skeptics may consider the fact that Musk’s Space X brought the price of delivering cargo into orbit down from $26,000 per kilogram in 1995 to $1,800 per kilogram by 2017, courtesy of the 100 percent reusable Falcon 9 rocket. The Falcon Heavy promises to drop that cost by another 50 percent within the next few years.

As the megacities of the future are built, tunneling machines will play an integral part in endowing these cities with efficient transportation systems. Tunneling underground to create upgraded, higher capacity, and smarter utility conduits to transport water and energy will also be necessary in cities of ultra-high density. Using the volume of underground space to host much of the physical plant of megacities will make the surface areas less congested and more pleasant.

The implications of building upwards and downwards as well as employing novel technologies ranging from enhanced geothermal systems to high-rise farming hold forth not only the oft wished-for promise of attracting humanity’s billions off the land and into densely populated megacities, but also the promise of cities that live nearly off the grid—cities that may, despite their magnitude, require very little from the rest of the world.

This is the optimistic scenario that is altogether feasible. A planet of megacities that might actually export power and food, along with culture and technology, in exchange for raw materials. There are many paths from here to there, but none of them are easy even with abundant and clean fossil fuel remaining an unhindered and major part of global energy supply until replacement energy technologies are fully competitive at scale.

Global prosperity and peace, glorious destination megacities, abundant water and food, voluntary population stabilization, asteroid mining, restored wilderness, and plenty of open land for those who still want to live under a big sky—all of this could be just around the corner.

This article originally appeared on the website American Greatness.

 *   *   *

Government Pensions Are Dividing Americans and Damaging the Economy

Now that financial markets around the world are experiencing a long-overdue correction, the best we can hope for is that we hit bottom before a deflationary cascade causes a worldwide depression. Those economists who believe in the long-term debt cycle may claim that this time the end has arrived, and they may be right. COVID-19, oil price wars, traders and investors hating Trump—these are just pinpricks. This bubble has been inflating for decades.

There have been plenty of warnings. Interest rates at near zero in the United States and actually negative in European nations. Record borrowing by the federal government, and, possibly worse, record levels of consumer debt. Corporate borrowing to buy back stock instead of invest in R&D and plant modernization.

In January 2000, at the peak of the internet bubble, total credit market debt in the U.S. was $27.8 trillion. By October 2007, at the peak of the housing bubble, total debt had climbed to $51.4 trillion. As of October 31, 2019, the most recent period for which data is available, total debt had climbed to $73.4 trillion.

Debt accumulation is not a sustainable way to stimulate growth. At some point, there is not a mere “correction,” such as what was seen in 2000 and 2008, but a fundamental restructuring of the financial economy of nations, such as happened in the 1930s. Has that reckoning arrived?

Either way, as of close on March 12, the Dow Jones had given up nearly three years of gains, with no real end in sight.

Wall Street’s Biggest Player: Public Employee Pension Funds

Which brings us to public sector pensions, which are among the most socially divisive, economically damaging scams that nobody has ever heard of.

To get an idea of the financial scale of public pensions, note that the U.S. Census Bureau estimates the total invested assets of pension funds managed on behalf of local, state and federal government employees is $4.3 trillion. Roughly 17 percent of Americans either work for or are retired from a local, state, or federal government agency.

By contrast, the Social Security Trust Fund, serving all 327 million Americans, and in which many government employees also participate along with receiving their pensions, has a total asset value of $2.9 trillion.

This is an incredible fact. Taxpayers—who it should go without saying, are paying for both systems—have contributed to a public employee pension system that is 50 percent larger than the Social Security Trust Fund, even though Social Security serves six times as many Americans.

By now most Americans, most definitely including voters, will have stopped reading. Pension finance is a boring topic. But public sector pensions pose a far bigger threat to America’s government budgets than Social Security ever will.

For starters, Social Security is adaptable. Lower the benefits, establish means-testing for benefits, raise the contribution percent, raise the contribution ceiling, raise the retirement age; all of these options are but one congressional vote and presidential signature away from implementation. Not so with public pensions, where financially responsible modifications to the pension systems are thwarted by collective bargaining contracts and union power. How bad is the problem?

Determining just how in the red public pensions are today depends on who you ask. And thanks to lax reporting requirements, good data is typically about two years behind. A Pew Research study released in June 2019 estimated the pension funding gap, “the difference between a retirement system’s assets and its liabilities,” for all 50 states, to be just over $1 trillion. But that’s only the officially reported number.

A study conducted by the prestigious Stanford Institute for Economic Policy Research put the total at over $5 trillion. This massive disparity in estimates is because how much has to be invested today in order to fund pension payments in the future largely depends on how much pension system fund managers think their investments can earn. Private-sector pensions have to use the bank lending rate as their required earnings estimate, which is why private-sector pensions are, generally speaking, not in financial trouble.

Public-sector pensions, on the other hand, are heavily influenced by government union bosses who want to maximize pension promises with minimum input either from their members through withholding or through direct contributions by government agencies. So they hire actuaries and money managers who claim they can earn, on average, 7 percent (or more) in interest on their investments, every year, year after year.

But what happens when they don’t?

That is where we find ourselves today. Pension funds, over the long term, are considered financially “healthy” if they are 80 percent funded or more. That means, for example, if the official numbers for 2018 are correct, the public sector pension assets nationwide were $4.3 trillion, the total liability was around $5.3 trillion, and the funds in aggregate were around 80 percent funded. There are big problems with this, however.

First of all, nobody believes the collective unfunded liability of America’s public employee pension funds is only $1 trillion. As noted, the Stanford researchers put that number at over $5 trillion. But most ominous is the fact that even if these pension systems were 80 percent funded, that is not where they’re supposed to be at the tail end of an 11-year bull market. Over the past 10 years, the U.S. stock market has tripled. Why are these pension systems, at best, only 80 percent funded?

Dividing Americans, Damaging the Economy

Public employee pension funds are among the biggest players, if not the biggest players, on Wall Street. If you want to know where literally trillions of dollars are being aggressively invested in private equity deals, hedge funds, and countless other speculative investments in debt, real estate, and foreign securities including in fascist China, look no further. These funds are under relentless pressure to deliver rates of return that are historically unsustainable, and the reason they are historically unsustainable is intimately connected to the populist discontent sweeping America today.

Public-sector pension funds, because they involve trillions of dollars, are too big to beat the overall rate of investment returns, and ultimately the rate of investment returns cannot exceed the rate of economic growth. The fact that investment returns have exceeded the rate of economic growth over the past few decades is precisely the reason there has been a widening in the gap between the super-rich and the desperately poor in America. It is the reason for the financialization of the American economy, where asset bubbles create collateral to create debt to create liquidity to create consumption to create profits.

This can’t go on, but the money managers want it to go on so public sector pension systems can buy another quarter of phony solvency. The alternatives are unpleasant to contemplate.

A few years ago the largest public sector pension system in the United States, the California Public Employees Retirement System with over $300 billion in assets, announced it was going to double the required payments from participating agencies over the next five years. That process is well underway and is the primary motivation for the hundreds of local tax and bond proposals on every primary and general election ballot in the state. If there is a recession, much less a depression, it won’t be enough.

Meanwhile, in the rest of America, those private-sector workers who are required to save money in 401k plans to supplement their eventual Social Security benefit, are now watching their retirement security vaporize before their eyes.

How is this fair? How is it that public sector employees can collect guaranteed pensions that pay, on average, two to three times as much as Social Security and, on average, are collected ten years earlier in life.

Defenders of public employee pensions point out that investment returns pay most of the cost for these pensions, not taxpayers. That’s only true, however, as long as those investments continue to deliver excellent returns. Once that assumption goes off the table, taxpayers pay for public-employee pensions. This results in higher taxes and lower services, and still doesn’t solve the problem of poorly regulated pension funds rampaging through the financial sector with trillions of dollars and grossly inadequate risk aversion, since they know taxpayers will pick up the tab whenever their schemes falter.

Public Sector Union Agenda Aligns with Big Finance

Public-sector pensions are yet another reason why the big corporate and financial sector political contributions in America overwhelmingly favor Democrats. These pension systems, and the benefits they provide, establish a common interest between government workers and big finance. Through the political agenda of their public-sector unions, which are overwhelmingly Democrat, the economic interests of public employees and America’s wealthiest elites are kept in perfect alignment.

No wonder public employee unions don’t fight open border policies. Not only do millions of destitute immigrants require more government administrators at all levels, but corporate profits—to help the pension funds—are boosted by the influx of cheap labor. No wonder public employee unions love draconian environmental regulations. The regulations create artificial scarcity—especially the policies of urban densification—and scarcity creates asset bubbles which help the pension funds.

No wonder public employee unions don’t object to exporting private sector jobs—international corporate profits translate into higher investment gains. No wonder public employee unions always support more bonds and borrowing—the proceeds expand government payrolls at the same time as underwriters and investors reap billions in commissions and interest payments.

And no wonder public employee unions don’t care if the welfare state implodes when the debt bubble pops and government deficits become unmanageable. Public employees don’t depend on the same network of taxpayer-funded social entitlements as the citizens they serve. To put it in terms that are crude but regrettably accurate, American citizenship is economically irrelevant to public employees. They are a separate class of Americans, exempt from the pitfalls of stressed public services, and exempt from the perils of market crashes.

The best thing that could happen to unite Americans would be to eliminate all public sector pensions and transfer the assets into the Social Security Trust Fund. One may endlessly argue the virtues or vices of Social Security, but compared with government pensions, Social Security has not split the nation in two, nor does it pose the same financial threat.

Unlike public employee pension formulas, Social Security benefits are progressive, meaning that high-income Americans have a lower ratio of contributions made to benefits received than low-income Americans. Unlike public employee pensions, there is a cap on Social Security benefits, and there is the ability to fine-tune the system to retain solvency.

Most important, however, if there is going to be a taxpayer-funded retirement security net for all Americans, it should be one system, with one set of formulas and incentives, equally applied for all citizens. If police, firefighters, nurses and teachers are heroes that deserve generous compensation, fine, let that take the form of higher salaries. Then they might invest their monthly surpluses into 401K plans, like the rest of us. And if that’s unacceptable, then they might make common cause with their private citizen counterparts to arrive at ways to improve Social Security. But all Americans would be confronting these problems together.

Patriotic members of the public sector must make some tough choices in the coming years. If lean years come, do they want America to be run by an international plutocracy, where citizenship is meaningless, but their own jobs as government enforcers are secure and lucrative? Or do they want American citizenship to still mean something? Pensions might be a useful litmus test.

This article originally appeared on the website American Greatness.

 *   *   *

Public Safety Compensation and Public Safety

Public sector unions are by far the most powerful special interest in California. And they are united in their goal to pay themselves as much or more than public agencies can afford, which shields unionized public servants from the worst effects of the laws (which they almost always support) that have made California’s cost-of-living the highest in the nation. But there are also significant differences between the various public sector unions in California.

Whatever else one might say about public safety unions, they have not undermined the quality of their profession. To the extent public safety in California is compromised, for the most part that is caused by policies the public safety unions unsuccessfully opposed including Prop. 47, Prop. 57AB 109, and AB 953.

This is in sharp contrast to California’s teachers unions, which by their opposition to charter schools and desperately needed union work rule reforms such as attempted in the Vergara lawsuit, make unconvincing their claims to care about results.

Any criticism of public safety unions should be in this context. Nonetheless, the case must be made that police and firefighter compensation in California has reached a level where at the least it is appropriate to replace their services whenever possible with less expensive solutions.

With respect to firefighters, an example of this can be found with private ambulance services which can, and often do, replace firefighter personnel to respond to medical emergencies. This solution can save municipalities millions of dollars, and can make economic sense without compromising the quality of service.

With respect to law enforcement, an example can be found in Newport Beach, where the issue is whether or not their harbor patrol requires deputy sheriffs, or if those services can be more efficiently performed by local law enforcement and city harbor patrol personnel. The financial impact of this choice is significant.

Using data available on Transparent California, according to analysis performed by local residents who know the names of the deployed personnel and could look each of them up individually, Harbor Patrol Officers and Harbor service workers earned, on average, total compensation in 2018 of $61,176. Even the park rangers employed by Newport Beach, which have “limited peace officer” status (including the power to make arrests) only averaged $84,740 in total compensation. This figure includes everything, base salary, overtime pay, current benefits and the employer’s pension payment.

By contrast, the same analysis showed the average total compensation of Orange County Harbor Patrol Officers assigned to Newport Harbor in 2018 was $291,571. Despite this amazing disparity in compensation, there is a strong case that the services of these Orange County Sheriffs are not required in Newport Harbor.

These figures are clearly debatable. Because most of California’s cities and counties (including Orange County) no longer include in their reports to Transparent California (or to the State Controller) a per employee cost of paying down their unfunded liability, Transparent California adds in their own estimate of that cost. In the case of Orange County, the unfunded liability is now $5.4 billion. Since continuing to fund and pay pensions depends on covering that liability, it’s hard to argue it doesn’t constitute part of total compensation. Also not added in these reports is the present value of the eventual cost for retiree health benefits.

Despite the particulars of this case, however, these personnel policies deserve urgent debate. Should sheriff deputies perform routine inspections and write up minor infractions? Should firefighters respond to medical emergencies? Why, when qualified specialists, often from private firms, can do this work just as well for less money?

Proponents of replacing county sheriffs with local employees make the following arguments. First, as documented by Frank Kim, the Executive Officer of Orange County, in a memorandum to the Board of Supervisors in August, 2018, only 3 percent of “hours spent in response to calls” in Newport Harbor were for criminal activities.” This means that 97 percent of the calls could have been handled by harbor service workers or limited peace officers employed by the City of Newport Beach at far less cost.

Another objection to replacing county sheriffs with local services is that the sheriffs “handle issues in the harbor, outside the harbor, and homeland security,” which supposedly means “the taxpayer is getting a bargain.” But in reality the Coast Guard, which berths a Coast Guard Cutter in Newport Harbor, is responsible for homeland security inside and outside the harbor.

As for other issues that may arise outside the harbor, such as assists for broken down vessels and sea tows, there are third party private companies that can (and do) handle calls for services outside the harbor. Moreover, the City of Newport Beach keeps three rescue boats outside the harbor during peak hours to handle any immediate shoreline calls.

Finally, there remains those 3 percent of calls that are for criminal activities, and clearly some of these criminal activities will involve situations that rangers with “limited peace officer” status will not be trained and equipped to handle. But the City of Newport Beach, at all times, has police officers stationed around the perimeter of the harbor. When very serious law enforcement issues arise, the City Harbor Patrol can simply pick up one or more of these police officers from the nearest dock to assist.

One barrier to pursuing more cost effective solutions to harbor services in Newport Beach is the fact that the Harbor Patrol Budget is funded by Orange County Parks, and is not part of the annual $700 million Orange County Sheriff’s budget. This takes away some of the incentive for the Sheriff’s agency to support more cost effective solutions. It is therefore up to the Orange County Supervisors to determine whether or not they can restore millions to their park budget by directing it to reimburse the City of Newport Beach for harbor security instead of continuing to pay the sheriff’s department for more expensive services.

One may have a civil debate over public safety compensation. There is a strong case to be made that police and sheriffs are not overpaid, since in California they face ongoing challenges to recruit new officers. If their pensions were reduced to a financially sustainable level, more police and sheriffs could be hired, and their base pay might even be increased without breaking municipal budgets. Hiring more officers would also reduce overtime expenses. But part of restoring financial health to California’s cities and counties requires making smart personnel decisions.

Hopefully California’s public sector unions – especially those which have not disgraced their professions – will begin to support letting go of some work assignments, when letting go makes financial and operational good sense.

This article originally appeared in the California Globe.

 *   *   *


Tom Steyer Proposes to Triple the Minimum Wage

Usually when billionaires run for political office, it is reasonable to expect they have a basic understanding of economics. In the case of presidential candidate Tom Steyer, however, one cannot make that leap of faith. Either Steyer has no understanding of economics whatsoever, which is extremely unlikely, or he does and does not care, or he is a pandering liar.

On February 9, speaking in South Carolina, Steyer said “he would call for a $22 per hour minimum wage if elected president.” This ups the ante on Steyer’s competitors in the Democratic presidential primary race, who are calling for an increase to $17 per hour.

Currently, the federal minimum wage is $7.25 per hour. If Tom Steyer were president, that rate would triple. Examining the consequences of such a move brings into sharp focus the dangerous absurdity of Democrat proposals. It offers additional reasons to vote for Republicans not necessarily because they are Republicans, but because they are not Democrats.

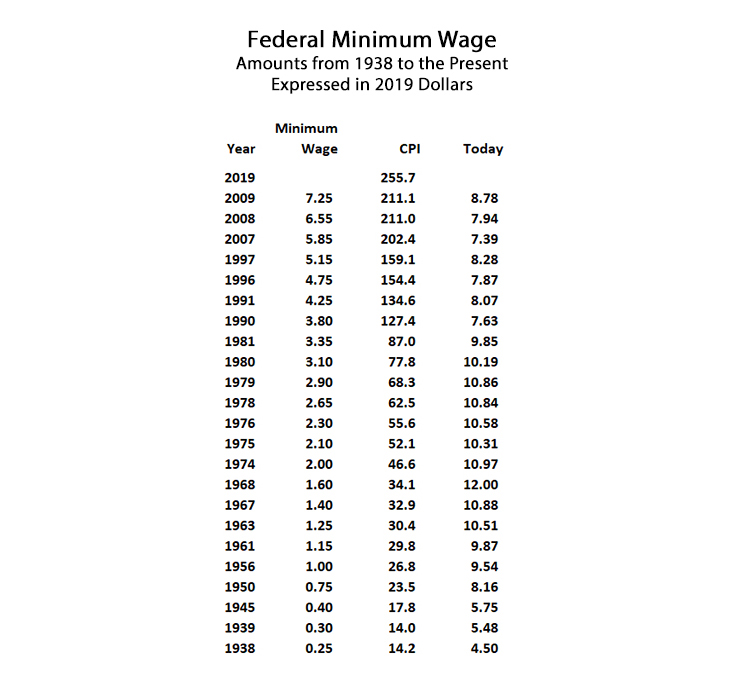
Shown on the chart below is the history of the federal minimum wage since it was first established in 1938. The first column shows the actual, nominal, minimum wage in each year the amount was raised. The middle column displays the consumer price index in each of those years. The column on the right then calculates what the minimum wage was historically, if expressed in 2019 inflation adjusted dollars.

As can be seen, if the minimum wage set back in 1938, 25 cents per hour, were expressed in inflation adjusted 2019 dollars, it would only be $4.50. Also evident is that the highest level the inflation adjusted minimum wage ever got was in 1979, when it was set – in 2019 dollars – at $10.86 per hour.

It’s just fine to argue about the need for some minimum wage. There are good arguments on both sides of that question. But what Tom Steyer is proposing is at best ridiculous, and he knows it. The obvious consequence of a minimum wage this high is that it makes it impossible for small businesses to stay profitable. The restaurant industry is a prime example. Large corporate chains automate and raise their prices. Small mom and pop restaurants go out of business.

In general, the job killing impact of an artificially high minimum wage is well documented based on the experiences in cities where it’s been implemented. Businesses that can’t adapt simply change jurisdictions or they close shop. And it’s not only these small businesses that become victims of a high minimum wage. These entry level jobs that go away create unemployment for people who would otherwise be entering the workforce and beginning to earn income and acquire skills.

Less obvious but equally significant is the impact on indexed wage scales. A relatively unknown but very common feature of collective bargaining agreements is that negotiated rates of pay are automatically increased when the minimum wage increases. Raising the minimum wage at any level, local, state or national, automatically raises wages across unionized workforces in the private and public sector. The ripple effect is therefore significant. When the minimum wage goes up, it drives consumer prices up across a host of industries that have to pass through the increased payroll costs, it can challenge the ability of businesses to survive if they have unionized workers at any level of wages, it drives businesses offshore, and it increases government payroll expenses leading to higher taxes.

What Steyer, the other Democratic candidates, and their union backers are doing is justified by a cost-of-living for Americans that has not been matched by increases in the average wage. That is a powerful argument, but artificially increasing wages will not solve that problem. When driving companies out of business, increasing unemployment, driving up consumer prices, and driving up tax rates is the consequence of increasing the minimum wage, then increasing the minimum wage is a fool’s errand. There is another solution, which is to lower the cost-of-living, and to lower the supply of labor.

America Needs to Lower the Cost-of-Living, Not Raise Minimum Wages

The sad irony is that these solutions used to be part of the union playbook. In past decades, unions fought for efficiently ran public infrastructure projects. These projects, often publicly funded but not rife with the padded budgets and paralytic bureaucratic delays that we see today, were vital elements in delivering a lower cost-of-living to the average American. In past decades, enabling infrastructure such as freeways, connector roads, reservoirs, aqueducts, water treatment plants, schools and parks were built swiftly and largely out of operating budgets. As a result, cities could expand, and homes were affordable, utility bills were affordable, and taxes were low.

Today these enabling infrastructure projects cost two to three times as much, and take five to ten times as long to complete. Most of the time they are funded via assessments on private homebuilders and developers, greatly increasing the market price of homes. If public funds are used, the money comes not out of operating budgets, but via public bond financing. What happened?

In the simplest terms possible, what happened is that America’s unions stopped fighting for the interests of all workers, and, for all practical purposes, joined forces with the corporations who used to be their adversaries. Oh sure, there are still strikes, and management and labor still quarrel, but they both are representing groups who have acquired and keep their privilege thanks to over-regulation. Unionized employees receive over-market wages, and corporations consolidate their market share against competitors with less financial resilience.

In the government sector, it’s even worse. Across blue-state America, unions control local and state elections, electing their own bosses. Why on earth would these union controlled bureaucracies fund infrastructure out of operating budgets, when instead they can use that money to pay themselves over-market wages, and fund pensions that are worth several times what Social Security benefits are worth to private sector workers?

Unions also used to fight the environmentalist lobby, but today, in addition to reaching a rapprochement with monopolistic corporations, they have allowed environmentalists to dictate their agenda. And why not? Environmentalists may only approve of one in five badly needed infrastructure projects, but who cares if each project is going to incur labor costs that are five times what they might have been if budgets weren’t padded?

This is easily exemplified by two California examples (of course), high speed rail and affordable housing. Construction of California’s “bullet train” still chugs along at a snails pace, but unionized workers have already been paid hundreds of millions, if not billions, to construct a small, overbuilt fraction of this useless monstrosity. But the environmentalists love it.

Similarly, the average cost of government funded affordable housing in California is now over $500,000 per apartment unit. But who cares? Environmentalist attorneys collect lawsuit settlements, public bureaucrats collect astronomical permit fees, consultants cash in on the required studies by experts, nonprofits build their empires, developers get subsidies and tax breaks, and unions operate under project labor agreements which means a swollen headcount and swollen wages.

Everybody wins except the normal, underprivileged, general public and the taxpayer.

What this points to is something bigger than unions, but very much related to the call for a higher minimum wage. What proponents of big government have done is over-regulate the economy, creating artificial scarcity which translates into an unaffordable cost-of-living for ordinary workers. They made housing unaffordable, then brought in government to build unaffordable “affordable housing.” And to cope with the high cost of housing and pretty much everything else that can’t be imported from overseas sweatshops, the bring in government to raise the minimum wage.

There was a time when unions performed an invaluable role in American society, because they stood up for all workers and supported policies that benefit all workers. This isn’t to say there weren’t aspects of unions that were and remain problematic. But on two key issues, unions have abandoned their own legacy and they have abandoned their membership.

Unions in America today no longer offer a counterbalance to the environmentalist lobby and as a result they no longer support vital enabling infrastructure. Even worse, they are demanding a massive increase to the minimum wage instead of calling for realistic restrictions on immigration, which would naturally force market rates for labor to rise.

Many high-profile Democrats in America, such as the bird brained Alexandria Ocasio Cortez, do not properly understand history or economics. Their ignorance can be forgiven, if nothing else.

Tom Steyer, however, does not get a pass. He knows exactly what he’s doing. And while he will never, ever be president – and he knows that, too – the hundreds of millions he’s investing in the 2020 election will influence countless voters to vote against the interests of their own fortunes as well as the fortunes of this nation.

This article originally appeared on the website American Greatness.

 *   *   *

Newsom’s 2020-21 Budget – A Big Pie, But Empty Calories

Governor Newsom has unveiled his budget proposal for the fiscal year 2020-21, and it comes in at a whopping $222 billion. That’s up from $209 billion last year, and sharply up from a few years ago. Backing up a decade, the 2010-11 budget totaled $130 billion. What on earth could justify a 70 percent increase in spending in just ten years?

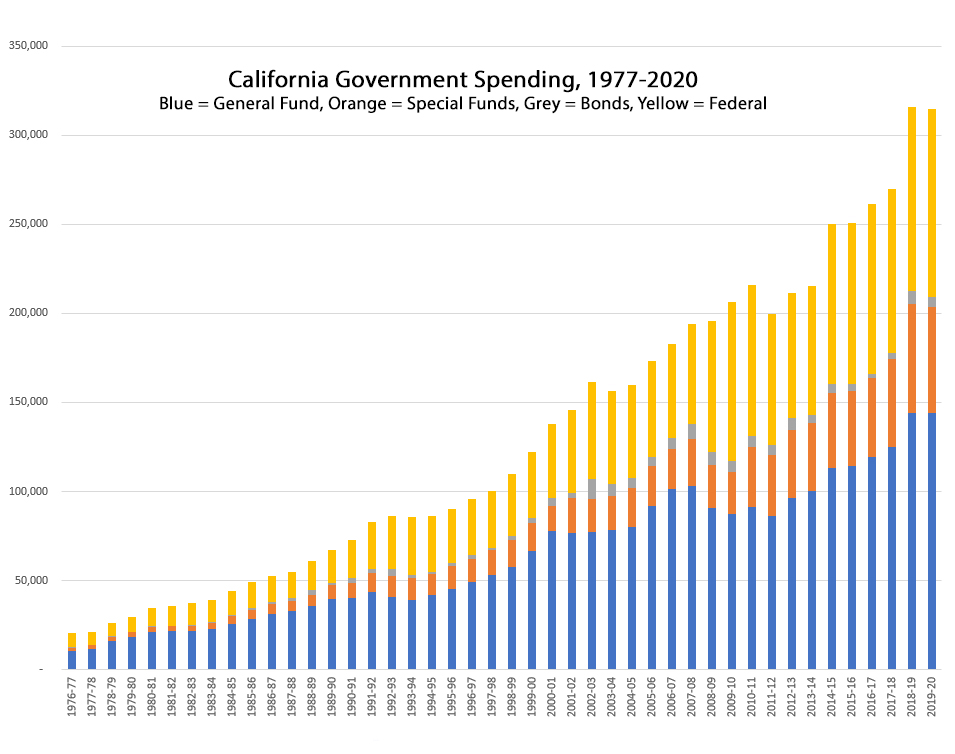
Shown below is the shocking growth in California’s state budget over the past forty years. The chart includes not only general fund spending, along with special funds and bonds, but also federal funds which are not included in the $222 billion total, but which are administered by the state and spent in California.

As can be seen, the growth hasn’t been uniformly up. There was a drop during the mild recession in the mid 1990s, another one in 2004-2005, and a plunge during the great recession that affected 2011 through 2014. But overall, spending growth over the past 40 years looks a bit like the proverbial hockey stick.

To have a fair discussion of spending growth in California, however, it is necessary to adjust for population growth and the impact of inflation. That is not a problem, since population data, CPI trends, and historical budgets are all easily found online. Back in 1977 California’s population was 21.9 million, and the CPI was 56.9. For the last five years, California’s population has hovered just under 40 million, growing by only a half million in that period of time, averaging barely 100,000 per year (ponder that fact, Gov. Newsom).

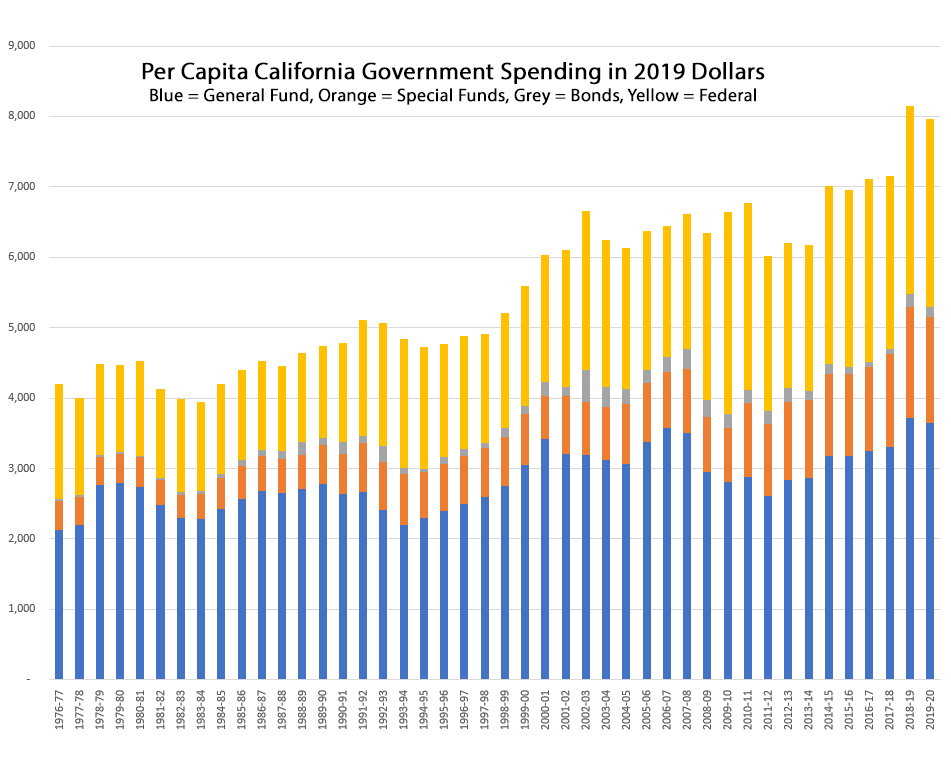
Shown below is per capita state government spending in California expressed in 2019 constant dollars. Viewing this information puts the current budget growth into context, and as can be seen, the trends are sharply upward, especially in the last two years.

Examining the categories of spending growth separately, all of the categories show huge increases. In constant 2019 dollars, per capita general fund spending has risen from $2,124 in 1976-77 to $3,650 in 2019-21. Special Funds spending has soared, from $418 per capita in 1976-77 to $1,507 in 2019-20. And Federal contributions to the state have also risen sharply, from $1,637 forty years ago to $2,669 today. In constant dollars, adjusted for inflation, per capita state spending in California has roughly doubled over the past forty years.

From this analysis, it should be obvious that California’s government has been spending more every year, a lot more, even after adjusting for population growth and the impact of inflation, and the trend has been nearly continuous for the last forty years. To suggest that Californians should pay more in taxes to support a near doubling in per capita government spending because Californians have more income today is so ridiculous that further analysis isn’t required. Just look around.

Compared to forty years ago, Californians cannot afford to purchase homes, they cannot afford to pay college tuition, they cannot drive on uncongested freeways, and they cannot expect their children to get a good education in public schools. Forty years ago, they could expect all those things.

There have been many improvements to our lives over the past forty years – the tech revolution and precision medicine, to state two obvious examples – but apart from cleaner air and less crime, the state can’t take much credit for improvements to the quality of life for Californians. The state can take credit, however, nearly exclusive credit, for making California unaffordable, for ruining California’s public schools, for driving up the cost of college tuition and neglecting our highways. And the state is fast losing all the gains that were made in fighting crime since the 1970s.

So while there are plenty of pet programs to assail in Newsom’s budget, and some trillion dollars in debt and unfunded liabilities that make mockery of the alleged surplus, the elephant in the room is to compare where we are to where we were. What happened? We spent more, much more, and life is harder, much harder. The workers are moving out, while the indigent pour in for the benefits and the super wealthy invest in security systems and beachfront property.

It’s important to ask where all this money goes. It’s important to make the obligatory pie charts and understand who gets what. But more important is why are we spending so much? What is the pie so much bigger today, yet provides less nourishment than ever?

This article originally appeared on the website California Globe.

 *   *   *

Public Employee Strike Looms in Santa Clara County

With 2020 upon us, it appears likely that two unions representing Santa Clara County employees will be going on strike. Unless agreements can be reached, 3,000 members of the Registered Nurses Professional Association will strike, along with over 11,000 members of the SEIU.

When one considers the political leanings of the Santa Clara County Board of Supervisors, which tilt overwhelmingly pro-labor in one of the most liberal strongholds in the world, it seems inexplicable that negotiations have reached an impasse. Inexplicable, that is, until you review the financial situation confronting Santa Clara County.

To get started, have a look at the most recent publicly available consolidated balance sheet for Santa Clara County, showing the change in their assets and liabilities between their fiscal years ending 6/30/2017 and 6/30/2018.

As can be seen from this table (found on page 7 of Santa Clara County’s most recent CAFR), the county’s total assets increased by an impressive $891 million between 2017 and 2018. But the county’s total liabilities increased by an even more impressive $2.1 billion over the same period, nearly three times as much.

Digging in, it isn’t hard to see what happened. Santa Clara County’s finance department finally decided to accurately represent the size of their unfunded retirement obligations. They increased their net pension liability by $545 million, and they increased their OPEB (“other post employment benefits,” typically retirement health insurance coverage) liability by $1.0 billion.

Anyone whose dug around financials long enough knows that the balance sheet is where the bones are buried. Simply expressed, sooner or later, liabilities sitting on a balance sheet have to be paid. And in the case of Santa Clara County and other agencies up and down the state, it’s turning into sooner rather than later.

The reason for this is because CalPERS, adhering to long overdue new requirements from GASB (the government accounting standards board), has decided to require their participating agencies to pay down their unfunded pension liability within twenty years. Previously, as this liability crept relentlessly skyward, creative accounting allowed payments to be deferred. The result can best be described as analogous to those negative amortization mortgages that were popular right up until the real estate bubble blew up in 2009.

To see what all this means in terms of actual county expenditures, refer to the official “Public Agency Actuarial Valuation Reports” provided by CalPERS for Santa Clara County. These reports disclose how much CalPERS is going to require Santa Clara County to pay them over the next several years.

How Much is Santa Clara County Going to Pay CalPERS?

According to a recent CPC analysis which consolidates the CalPERS projections for all major employee groups (download here), during the current 2019-20 fiscal year, CalPERS is demanding $652 million from Santa Clara County. Of that $652 million, Santa Clara County employees, via payroll withholding, will contribute $145 million, or 22 percent. Put another way, for every five dollars that taxpayers send to CalPERS this year to fund Santa Clara County employee retirement pensions, those employees themselves will kick in just over one dollar.

It gets worse. By the 2025-26 fiscal year, CalPERS will require Santa Clara County to pay $904 million to keep their pensions afloat. And of that total contribution, county employees will themselves be required via payroll withholding to contribute $170 million, or 19 percent. The employer share will increase by $227 million, or 45 percent. By 2025, for every five dollars that taxpayers send to CalPERS to fund Santa Clara County employee retirement pensions, those employees themselves will kick in less than one dollar.

Santa Clara County’s board of supervisors is staring down an increase to their annual CalPERS payment that in a few short years will be nearly a quarter-billion dollars higher than it is today. And based on the recent billion dollar bump to the county’s OPEB liability, Santa Clara County payments to fund retiree health care are also set to dramatically increase. This is the implacable financial reality that is behind their tough negotiations with the unions.

How Much Are Santa Clara County Pensions?

The website Transparent California has a helpful summary search page “View pensions by last employer.” On this page, by selecting “View all CalPERS employers,” it is possible to view “average pension and benefit amount for full career retirees” for each employer. As can be seen, Santa Clara County employees who have worked for 30 years currently collect an average annual pension of $84,349, not including benefits such as employer subsidized retirement health insurance.

This is an astonishing sum, considering the maximum Social Security benefit – only paid for high wage earners once they’ve reached the age of 70 – is $45,480. For a 62 year old, which is a far more representative comparison, the maximum Social Security benefit is $27,180, less than one-third what the average Santa Clara County employee receives.

It is important to emphasize that using full-career pension averages is the only valid means of comparison to private sector retirement benefits. It is common to read statements from public sector union officials claiming the “average pension” is only $30,000 per year, or less. But they are including in these averages those recipients who only worked a few years, and barely vested their pensions. This is an inaccurate basis for comparison, because people who have only worked a few years in the public sector would presumably have spent their other working years in the private sector, earning social security and saving what they can in a 401K plan like the rest of us.

It is easy enough to review the actual individual pension data for Santa Clara County’s retirees. Here’s the link to Transparent California’s 2018 data. For each individual, it shows the amount of their pension, the year they retired, and their total years of service. Most people who view this data for the first time are amazed.

How Much Do Santa Clara County Employees Make?

Answering this requires understanding a few layers of assumptions. The most detailed primary source of data is the PublicPay.gov website managed by the California State Controller. On that website, Santa Clara County employees are shown for 2018 to average $92,069 in regular pay (plus overtime and other pay), along with $23,348 in employer payments for current and future benefits. That would mean that according to the State Controller, the average total compensation for a Santa Clara County employee was $115,417 in 2018.

This, however, is the low number, for two very significant reasons. First, as the state controller states, “employees who work partial year and/or part-time are counted as full time employees in the averages calculations.” This makes a big difference, as does the state controller’s other disclosure, “this county does not include payments toward the unfunded liability of the employer sponsored retirement plan.”

To get at Santa Clara County’s average for full-time employees with benefits, the raw data is available from the state controller on their “downloads” page. The 8.4 MB “2018 County Data” file includes detailed records for 22,159 Santa Clara County employees. In the CPC analysis that can be downloaded here, records for part-time employees were not included in the average. To do this, the records were screened to eliminate employees who were not collecting benefits, made less than $30,000 in base salary, or made less than the minimum specified base salary for their position.

These results are startlingly different from what the state controller reports. Instead of total pay averaging $92,069, and total benefits averaging $23,348, when screening out part-time and temporary workers, Santa Clara County employees average $118,220 in total pay, and $32,285 in total benefits. That’s an average total compensation of $150,505. But there’s more. What about the “payments toward the unfunded liability”?

Understanding this last element of total compensation underscores the inadequacy of pension reform to-date. Because of the $652 million that CalPERS will collect from Santa Clara County this year, $298 million will be to pay down the unfunded liability. That comes down to another $17,000 per each of Santa Clara County’s full-time-equivalent employees, an amount that’s rising every year. Of the $904 million coming due in 2025, $473 million will be to pay down the unfunded liability. Pension reform negotiations have never included any role for public employees themselves to pay down the unfunded liability, despite the fact that the benefits they receive depend on it being paid down.

Much more should be said about how CalPERS was, and is, understating the normal contribution in order to shield public sector workers from the true cost of their pensions. For a focused discussion on this topic, read “How Fraudulently Low ‘Normal Contributions’ Wreak Havoc on Civic Finances.”

If anyone is still reading this, there is yet another eye-glazing but nonetheless significant factor, the cost of OPEB (primarily retirement health insurance). For Santa Clara County’s public employees, this is an unfunded liability that is even bigger than the one for pensions. And this, too, must be prefunded and assessed as part of total compensation, if one is to accurately report on how much Santa Clara County employees are really making in pay and benefits.

To summarize, when taking into account the true cost of responsibly prefunding all of their retirement benefits, the average total compensation for Santa Clara County’s public employees, today, is already easily in excess of $170,000 per year.

What Are Reasonable Solutions to Santa Clara County’s Employee Disputes?

Jennifer Celaya, a Santa Clara County employee, wrote in support of a strike earlier this year in a guest column in the San Jose Spotlight. Here’s what she had to say about pensions: “One of the biggest public concerns is public employee pensions. Nevertheless, public employees are not the ones who lost hundreds of millions of dollars by making highly risky investments with public pension funds. The culprit is CalPERS, not the workers. An honest evaluation of CalPERS’ performance demonstrates poor judgement and insufficient returns. Some of those investment decisions have over the years led to serious loses, such as their ENRON and PG&E investments.”

Celaya is right. It is CalPERS fault. But the blame goes back further than their investment decisions of the past few years. It goes all the way back to Senate Bill 400, enacted in 1999, which increased pension benefit formulas by roughly 50 percent for California Highway Patrol officers. Over the next five years or so, nearly every state agency, city, and county in California followed suit, not only for their police and firefighters, but for all public employees regardless of their job description. The ongoing financial impact of this on civic budgets has been severe, and there is no end in sight.

One can easily make the case that CalPERS failed to disclose the costs of this historic bump in pension benefit formulas. But then again, before blaming CalPERS exclusively, it might be fair to take a look at who controls CalPERS. Of the 12 active CalPERS board members, only two of them have significant private sector experience. Most of them have spent their entire careers working for state and local government agencies in California. Only one of them has a CPA. Four of them have served as officials with public employee unions or union affiliated organizations, including SEIU, CSEA, and CPOA.

Overwhelmingly, the CalPERS board of directors consists of people who have spent their lives in the public sector, who themselves will collect public sector pensions. Only a few of them have the formal training and professional experience in finance and investments that would qualify them to govern the largest public employee pension fund in the United States. And it shows.

CalPERS has made plenty of mistakes. But they’ve worked in lockstep with public sector unions, who exercise strong influence on their board of directors. For decades, the shared agenda appears to have come down to three fundamentals: maximize benefit formulas, minimize required employee contributions via withholding, and minimize employer contributions by employing creative accounting. What did they think would happen?

Solutions to Santa Clara County’s current employee dispute would require the unions and the employees they represent to recognize some hard truths.

For starters they might understand the county is facing financial challenges that make it almost impossible for them to grant the demands the union is making. They might also recognize that apart from a highly visible cadre of super rich high tech entrepreneurs, nobody can afford to live in Santa Clara County. They might count their blessings to have such generous benefits, and realize that even if they start paying significantly more via payroll withholding to fund those benefits, they’re still getting a deal that is far better than what nearly everyone in the private sector can ever hope to expect.

For their part, the Santa Clara County supervisors might take a look at why the cost of living is so high in Santa Clara County, and everywhere else in the state. They could explore solutions that would involve less government instead of more government, starting with reducing the absurd, crippling restrictions and mandates governing market construction of housing. They could do that, instead of spending billions on “affordable housing” that their cronies somehow can’t seem to turn in at costs below $600,000 per unit.

The idea that Santa Clara County’s board of supervisors is unsympathetic to the grievances of their unions is absurd. They are probably one of the most pro-union, pro-labor, liberal, left-leaning board of supervisors in America. They simply have to convince the unions, and the workers they represent, that either they pay more for their benefits, or cut their benefits, or they should have no expectation of higher wages. Then they might turn their attention to identifying what part they’ve played in making life unaffordable for everyone living in the Santa Clara Valley, and consider new policies.

This article originally appeared in the California Globe.

 *   *   *

The Boondoggle Archipelago

Across California, there is a growing string of islands, exquisite gems in the urban ocean. Dredged from the pockets of taxpayers, constructed by elite artisans, these pristine islands have been created at stupefying expense. But their beauty is seductive. Spend more!

Each time an island is completed, or even proposed, glowing reports are logged across the land. So fortunate are those who shall live on these islands! So wonderful are those who shall build these islands, and care for their inhabitants! What a magnificent, marvelous thing we have done!

Or have we? From deep within the ocean a seismic wave is building, triggered by reality and propelled by common sense. Because these islands, more properly referred to as homeless shelters, supportive housing, and “low income housing,” are far too small, and far too precious, to ever, ever accommodate every castaway that needs a roof over their heads. They will never offer the required land mass to solve the problem. Instead, history shall know them as California’s Boondoggle Archipelago.

The builders of the Boondoggle Archipelago hide behind laws they won’t try to change, and behind court rulings they won’t challenge, and happily follow the rules. Happily, because the rules are rigged to ensure that the vast majority of California’s homeless and low-income families shall remain forever adrift, and so long as there are castaways, there’s money for the builders.

A short cruise across the urban ocean from north to south, visiting various typical islands in California’s Boondoggle Archipelago, should offer ample evidence that no amount of money will ever solve the problem, and therefore billions and billions of dollars, year after year, shall continue to line the pockets of the builders.

In Oakland, the “Estrella Vista” project, at a cost of $64 million, offered 87 units of affordable housing. That’s $736,000 per unit. An analysis of the project costs debunks the misleading notion that the only public money invested in these units came from Alameda County’s Measure A1, passed in 2016 to allocate $580 million to “affordable housing.”

While Alameda County’s Measure A1 Bond only contributed 3 percent to the cost of Estrella Vista, matching loans from the City of Emeryville (7.2%), the City of Oakland (3.2%), plus other federal and state sources (17.6%) constituted much of the remainder. The biggest source of funds, “LIHTC Equity,” at 42.9 percent, bears further explanation.

LIHTC stands for “Low-Income Housing Tax Credit,” and these tax credits, which can be bought, sold, and traded, represent a one-to-one reduction of a corporate tax bill. They are not a tax deduction, they are a tax credit, meaning that for any profitable corporation that pays taxes, their face value is equivalent to that same amount of cash in the bank. Who pays for tax credits? Taxpayers, since whenever taxes are avoided in one place, the resulting shortfall in tax revenues has to be covered by other taxpayers.

This is typical.

San Jose’s Measure A, approved by voters in 2016, allocated $950 million to construct affordable housing. Supposedly this beast of a bond will fund the construction of 4,800 units of affordable housing. That would come out to a supposedly reasonable average per unit cost of $198,000 (“supposedly reasonable,” because the national average cost to construct an apartment unit is only around $75,000). But not so fast. Courtesy of the County of Santa Clara Office of Supportive Housing, let’s examine this island chain.

The “Veranda” will offer 19 units at a total development cost of $11.9 million; that’s $626,000 per unit. The “Villas on the Park,” 84 units for $476,000 per unit. The “Gateway,” 75 units for $406,000 per unit. The “Crossings,” 39 units for $586,000 per unit. “Quetzal Gardens,” $706,000 per unit. “Leigh Avenue,” $780,000 per unit. Wading through the 15 new housing projects that have disclosed funding details, San Jose’s Measure A is part of a larger funding package – nearly all of the money coming from taxpayers – that will construct 1,357 units at a cost of $748 million. That’s $552,000 per unit.

On November 5th, San Franciscans approved Prop. A, which means their home owners will be paying principal and interest on another $600 million to build “affordable” housing. A careful review of the actual text of the ordinance indicates this money may not actually construct a single unit of new housing. Instead, the terms of this bond could be fulfilled merely by rehabilitating existing housing.

An October 7th, 2019 report in the San Jose Mercury offers a vivid example what “rehabilitation” accomplishes in the real world. The article describes how an apartment building in Antioch was converted to affordable housing, but when the renovations were completed, the tenants actually ended up paying more in monthly rent. To stay in their homes, they had to win the subsidies lottery, and rely on ongoing government assistance. Most moved out, replaced by the lucky few.

How is this helping anyone?

Rehabilitation of existing units brings us to our first island in the southern seas of California’s Boondoggle Archipelago. On October 24, Curbed LA reported that the Los Angeles City Council unanimously voted to provide an additional $24 million in homeless housing bonds to “repurpose a building on the Veterans Affairs campus in West Los Angeles for housing for veterans.” According to the article, the rehabilitated building would provide 59 units of permanent supportive housing for homeless and chronically homeless senior Veterans.

According to Ryan Thompson, writing for VeniceUpdate.com, the developer’s budget for this rehab project is $54.6 million, which equates to a per unit cost of $926,000. In his write-up, Thompson not only questions the astronomical per unit price tag, but the entire process whereby these contracts were awarded and how the designated developers were selected. It warrants close reading.

Political patronage to the well connected builders who are generous with their campaign donations. Nonprofits exploiting their tax exempt status and hiding behind their benevolent public image while they rake in hundreds of millions. Endlessly growing flotillas of public bureaucrats. A lottery to anoint the lucky occupants of the few, but spectacularly expensive, island refuges. Market rate builders setting sail for new, more competitive oceans, far, far away. Millions of castaways remaining adrift in the urban ocean. These are the consequences of the Boondoggle Archipelago.

Spending up to one million dollars per unit to not even create new housing, but to upgrade an existing structure, is not an outlier. These astronomical costs are common. In Venice Beach, a new structure being proposed to accommodate homeless and low income residents is budgeted, including the value of the land, at over $200 million, in order to create 140 new apartment units. That’s a cost of $1.4 million per unit.

In order to assist the homeless, in 2016, Los Angeles voters approved Prop. HHH, authorizing $1.2 billion to construct “supportive housing.” As reported by the Los Angeles Times, the total project cost, on average, for the few thousand units that will eventually get built is $550,000 each.

What’s really going on here? Are the builders who take taxpayer money to build these island paradises smooth sailors or brazen pirates? And with tens of thousands of homeless and literally millions of “low income” Californians, who do they think they’re kidding? After all, at a price tag of $500,000 each, and evidence suggests that is on the low side, it would cost $65 billion just to house California’s existing homeless. It would cost orders of magnitude more than that to build “affordable housing” for all of California’s qualifying low income families. And are these actually island paradises, or state administered wards?

The most evocative use of the word “archipelago” in the 20th century was not used in a benign context. It was “The Gulag Archipelago,” the title of a book by Alexander Solzhenitsyn that called the world’s attention to the network of prisons and labor camps that absorbed millions of Russians during the Soviet era. And during the second half of the 20th century when Solzhenitsyn was writing his book, across America we built our first Boondoggle Archipelago – housing projects. They were built, they were occupied, they demonstrably failed to alleviate poverty in the inner city, and now they’re being demolished.

What did we learn? Apparently, all we learned was spend more. Do it again.

The Boondoggle Archipelago is defined primarily by the corrupt patronage it exemplifies. But it’s worth stepping back and asking the question – are we not only wasting hundreds of billions of taxpayers money, but also condemning hundreds of thousands of Californians to dependency?

If the builders and supporters of the Boondoggle Archipelago are sincere in their desire to help the homeless and the needy, they would first try the following solutions: Overturn the court settlements that prevent arrests for vagrancy, and repeal Prop. 47 so users of hard drugs and petty thieves will again face jail time after repeat offenses. Do that, and see how many “urban refugees” suddenly find shelter again with their relatives or their friends.

Then construct tent cities, taking advantage of the knowledge the U.S. Military has gained in setting up these compounds all over the world. Round up the homeless and put them into the appropriate facility – one type for substance abusers, one for petty thieves and other minor offenders, one for mentally ill, and one for families and individuals who are genuinely down on their luck. Over time, if appropriate, move these people into better shelters – but put a cap on the costs.

At the same time, to make housing affordable for low income Californians, end the environmentalist war on land development. Repeal the California Environmental Quality Act, since federal law provides ample protection. Repeal SB 375 and similar laws that have made it nearly impossible to develop open land. Start using public money to build more enabling infrastructure. Quit forcing developers to spend more money preparing permit applications and paying fees than they spend in actual construction. Then turn private investors loose to again build market housing at affordable prices. Today, developers either turn crony, or move to other states. They have no choice. The laws are rigged.

Or just stay the course on the urban seas, filling your drift nets with billions in taxpayer cash.

California’s policymakers, state and local alike, can keep throwing money into the Boondoggle Archipelago. But recognize what these facilities really are. They’re housing projects; a failed model.  When people are drowning, you don’t build them an island. It takes too long. It costs too much. You throw them a life preserver.

This article originally appeared on the website California Globe.

 *   *   *