How Libertarians Aid and Abet Oligarchy

The list of reasons Trump is no longer President of the United States is endless. In a close election, any significant factor can be cited as the straw that broke the camel’s back. And in the years and months leading up to November 2020, there were some very big straws. Nonstop harassment by a Democratic House of Representatives and Democrat operatives embedded in federal agencies, an unbroken four year streak of media mudslinging, partisan censorship by online communications monopolies, opportunistic laws, court rulings and administrative edicts designed to increase the number of Democratic votes, and literally billions in partisan donations specifically targeting voters in Democrat-heavy cities in swing states.

Fraud as well? Sure. But the election was rigged with or without fraud.

The presence of a libertarian presidential candidate? Also yes, though difficult to prove.

When it comes to the loss of GOP control of the U.S. Senate, however, one single event stands out from the pack. The candidacy of libertarian candidate Shane Hazel, who threw the battle between Republican David Perdue and Democrat Jon Ossoff into a runoff. It is true that maybe Perdue could have won his runoff if various external events hadn’t affected turnout on 1/05, but that’s beside the point. If Hazel hadn’t been a spoiler, there would not have been a runoff.

Perdue only needed 0.3 percent on November 3 to win. To suggest that Hazel wouldn’t have attracted another 0.3 percent of Republican votes, when Hazel garnered 2.3 percent of all votes, is lunacy.

Shane Hazel deserves the spotlight for causing this debacle, and apparently he’s relishing the attention. In an article published in Reason shortly after the November election, responding to criticism over his decision to use his candidacy to force a runoff, said “Give me your tears. They are delicious.”

Was Hazel fully aware of what he was saying? Did he understand the full impact of what he’d done?

Libertarians who assert that their candidates have a right to run for election are correct. They do. But exercising that right when it literally costs Republicans control of the U.S. Senate is not a responsible use of that right. It’s a destructive adherence to ideals over reality. It reflects the same libertarian mindset that claims online communications platforms with monopoly powers are merely exercising their rights as private companies when they demonetize, shadowban, deplatform individual content creators, and now, even deplatform entire platforms.

Right-of-center Americans, of which libertarians are only one segment, are correct to be disillusioned by the performance of the Republican party. For that matter, despite the many obstacles, nearly all of them unfair, Trump himself could have done some things differently. But despite the imperfections of the party and its leader, they’re going to be sorely missed.

Will Shane Hazel, and every other smug libertarian spoiler bent on sabotaging the prospects of Republican candidates, find it “delicious” when the Biden administration and a wholly owned U.S. Congress begin to impose their vision on America? Maybe they will. After all, legalized drugs, open borders, “free trade,” privatized, owned space, destruction of single family zoning and online censorship by monopolies are all policies supported by libertarians, progressives and neoliberals alike. It is also the agenda of America’s multinational corporations, in an irony that ought to be obvious by now to ordinary voters.

Republicans in 2020, for all their flaws, were not the favored party of corporate America. And unlike Democrats, by and large they had not succumbed to the oppressive agenda pursuant to combating “climate change” and “systemic racism,” both of which are designed to further the power of big corporations and big government.

Maybe, ultimately, it is inaccurate to claim libertarians care about a decentralized economy. What libertarians fail to appreciate is that America can be just as thoroughly dominated by big corporations and powerful oligarchs as it can by big government. The fascist marriage of big government and big corporations has erased the necessary tension between those two primary centers of power in America, a tension that was necessary to preserve individual freedom and the competitive prospects of small and emerging businesses.

So maybe libertarians need to be rebranded. Maybe they’re not “libertarians,” but fascists that favor top-down rule as long as it’s “corporate” instead of “government.” Yeah yeah, we know the disclaimers. “We decry crony capitalism. We deplore corporate welfare.” Problem is, libertarians, the corporate invasion of society has progressed well beyond these favored tropes. America’s transition to a corporate oligarchy is nearly complete. And in that process, libertarians like Shane Hazel have been a big help.

Down here in the real world, the impact on ordinary Americans is the same. We are owned. We are not free. And all the permissive drug laws and open borders and big tech enabling in the world will not make us free. Shane Hazel. At best, like every other libertarian politician in America, is a progressive dupe. At worst, and consistent with political theory, he is an economic fascist. How does that sound to you Shane? Is it delicious?

In a scathing essay published last week in American Greatness, “paleolibertarian” Illana Mercer thoroughly deconstructs the ongoing libertarian defense of big tech censorship. More importantly, she exposes the fallacy of considering the state to be the only potential source of tyranny, and calls for “fresh theoretical thinking.” She writes:

“Discrimination, aver the libertarian-minded among us, is the prerogative of private property. Or, so we console ourselves. We’re safe. After all, aggression for aggression’s sake, as we libertarians have long maintained, is the modus operandi of the state, not of free enterprise. Yet, here we are! In more effectively banishing people and their products from the market, private multinationals are posing a serious competition to the State. And therein lies the rub. Fresh theoretical thinking about the meaning of Deep Tech begins with an understanding that we live and labor under tyrannical corporate statism, or tech-dominated statism.”

Shane Hazel is now intending to run for Governor of Georgia in 2022. Let’s be perfectly clear: This man is a troll. His odds of ever winning an election are near zilch. But he will get plenty of attention, and along with others like him, he may destroy the Republican party. And while Shane Hazel probably doesn’t look in the mirror and say “I’m a fascist,” that is what he is enabling with his antics. Him, and every other libertarian that isn’t willing to come to terms with the consequences of their actions.

This article originally appeared on the website American Greatness.

 *   *   *

The Homeless Industrial Complex and the California State Budget

AUDIO/VIDEO:  How attempts to help the homeless have been taken over by the Homeless Industrial Complex, a system of legalized corruption where billions of dollars are wasted building “supportive housing” at a cost of over $500,000 per unit, and only developers and politicians benefit. 2nd segment: A quick look at California’s just-released 2021-22 State Budget proposal  – 18 minutes on KABC Los Angeles – Edward Ring on the Larry O’Connor Show.

California’s General Fund Relies on Bailouts and Billionaires

One of the biggest reasons California’s technology moguls supported the Biden/Harris candidacy had nothing to do with ideology. It had to do with their pocketbooks. Because with a Californian presiding over the Senate, and a Californian Speaker of the House, expect federal bailouts to flow west by the hundreds of billions.

The likelihood of federal money to prop up failing local governments, state agencies, and public employee pension funds has just gone from remote to probable, as Democrats take control of all three branches of the federal government later this month. Simultaneously, and as a result of this political outcome, the likelihood of massive new state taxes here in California targeting the super rich drops from probable to too-close-to-call.

Consider the impact of Assembly Bill 2088, if enacted, on California’s wealthiest households. This “wealth tax” will impose, year after year, an annual tax at a rate of 0.4 percent of any California resident’s worldwide net worth in excess of $30 million.

To use the example of California’s richest man, Elon Musk, who according to Forbes had a net worth in early January of $176 billion, AB 2088 would require Musk to pony up 704 million, every year, for the privilege of living in California. Mark Zuckerberg, with a current estimated net worth of $92 billion, would have to pay the state $368 million. Every year.

It is easy enough to understand the emotional indifference that a libertarian might display towards Musk getting soaked for $704 million per year, or that a conservative might display towards Zuckerberg having to turn over $368 million per year, or that liberals arguably feel towards anyone wealthy being forced to pay their “fair share.” But California’s rich already pay a huge share of California’s total state tax revenues.

For example, the Governor’s Budget for 2019-2020 projected 69 percent of all general fund revenue to come from personal income taxes. Another 20 percent came from sales taxes and 9 percent from corporation taxes. The other 3 percent came from a variety of sources, mostly insurance tax. While property tax is a significant source of revenue, it is a local revenue source and only impacts the state budget insofar as when property taxes go up, it relieves pressure on the state to allocate more out of the general fund to support local schools and other local agencies.

Bearing in mind that nearly seven out of every ten dollars going into California’s general fund comes from personal income taxes, the following chart shows who is paying those taxes. Using Franchise Tax Board data from 2018, and sorted by the reported taxable income of the 16.8 million Californians filing returns, it is immediately apparent that nearly everyone paying taxes made under $100,000. That is, 13.2 million Californians, or 78 percent of the people filing state income tax returns, contributed only $7.8 billion or 9 percent of the total personal income taxes collected.

On the other side of this chart, to the right, the flipside of this top-heavy equation is presented. There were 89,000 Californians in 2018 that reported taxable income of over $1.0 million. At one-half of one percent of the total filers, their numbers don’t even register on the chart. But the orange column, representing the $34.5 billion they paid in taxes, dwarfs the contributions from the other brackets. One-half of one percent of California’s taxpayers paid 40 percent of all personal income taxes.

Moving one notch to the left to incorporate the filers who reported taxable income in excess of $500,000 in 2018 yields further evidence of just how top-heavy California’s reliance is on the wealthy to fund state government operations: Only 275,000 individuals, representing 1.6 percent of tax filers, paid 56 percent of all personal income tax revenue, which in turn is 40 percent of ALL general fund revenue in the State of California.

It is easy enough to scoff at the prospect of extremely wealthy people having to pay more. But one way or another, California’s state government needs more money. Governor Newsom’s proposed 2021-2022 state budget proposes record spending. He does this in the face of structural deficits that existed before COVID-19 trashed California’s economy. The pandemic drove the global economy online, disproportionately helping California’s tech industry, but how much higher can tech stocks soar, and how much more will the tech billionaires pay?

In addition to a wealth tax, still under consideration in the state legislature is Assembly Bill 1253, which would impose “three new surcharges on the state’s highest earners: 1% for taxable incomes over $1 million, 3% for incomes over $2 million and 3.5% for incomes over $5 million, meaning California’s wealthiest could pay 16.8% on their taxable income.” The tax is expected to generate over $7 billion per year.

Of the two bills, AB 1253 is more likely, since it would not require the gyrations that a precedent setting wealth tax would require. But would California’s wealthy residents leave the state? The litany of reasons California is driving away residents and businesses is long and compelling, with high taxes having an impact along with exhausting, endless regulations, a punitive cost-of-living, and a passive-aggressive bureaucracy.

Back in the 1950s and 1960s, Californians paid relatively high taxes (for the time), but got plenty for their money. Californians saw their taxes used to build a massive, statewide system of water storage and distribution, beautiful freeways to tie together the growing cities, and the finest public university in the world.

Today Californians live in a state of 40 million people with an infrastructure designed for 20 million people. New infrastructure projects are rarely approved, and when they are, more money is spent on litigation and bureaucracy than on actual construction. Thanks to preposterously overwritten regulations, California’s homebuilders cannot profitably build affordable homes without collecting government subsidies. California’s timber industry could thin the forests and would pay taxes on their earnings, but because they have been regulated nearly into oblivion, California’s forests burn like hell, year after year. One could go on.

Perhaps California’s weather and scenery will keep the super rich around. Perhaps California’s generous social benefits and decriminalization of petty theft and public intoxication will guarantee a growing population of indigent. But the middle class and the small businesses are leaving. That’s a problem for everyone, including those who can afford to stay.

While the wealthy contribute 40 percent of all tax revenues to the state’s general fund, it is the middle class and small businesses that pay most of the other 60 percent. With every moving van that heads east, more of that burden transfers to the wealthy. They had better hope their gambit has paid off, and their new friends in Washington DC are generous indeed.

This article originally appeared in the California Globe.

 *   *   *

Placentia’s Independent Fire Dept Saves Millions and Improves Service

On July 1, 2020, the City of Placentia formally terminated its contract with the Orange County Fire Authority, where the average operations employee in 2018 collected pay and benefits in excess of $241,000. Seeking to create a new model that reduced these unaffordable levels of pay and benefits, as well as made more efficient use of personnel, and despite bitter opposition from the firefighters union, the City Council spent the year prior to July 2020 designing and building an independent fire department.

With over three months of operations now behind them, it is possible to review early results of Placentia’s experiment. According to the city’s “final quarterly update” on Placentia’s Fire and EMS Services, released on October 20th, in their first three months of operation, the new independent fire department serviced 40 percent more daily calls than the prior year with OCFA, reduced local response times by over 3 minutes when compared to OCFA, and reduced the need for mutual aid from neighboring cities by 85 percent.

One of the ways Placentia accomplished this was by using ambulances and paramedic squad units to respond to medical emergencies instead of 55,000 pound fire trucks. To further reduce response times, the city also invested in emergency vehicle traffic signal preemption devices through major intersections. To reduce costs, in addition to relying on ambulances for strictly medical calls, the city contracted with part-time firefighters and fully trained reserve volunteers instead of paying overtime to fill absences and vacancies. The city also replaced the firefighters CalPERS pensions with a 401K plan.

In response, neighboring agencies in Orange County have resisted Placentia’s innovations by not signing automatic mutual aid agreements, an arrangement that is the standard method whereby fire departments with adjacent jurisdictions assist each other. Not only does this allow more firefighting resources to be quickly applied to fires too big for one small department to handle, but more commonly it is the way that the nearest station responds to emergencies regardless of jurisdictional boundaries.

A troubling complication relating to these automatic mutual aid agreements is that even in the case of Fullerton, which did eventually enter into an agreement with Placentia, Fullerton’s fire department is not making full use of the agreement. Reached for comment via email, Placentia’s city manager, Damien Arrula, offered considerable detail on this situation. The next four paragraphs constitute his lengthy response, which merits publishing in its entirety:

“While we have successfully entered into an auto/mutual aid agreement with Fullerton, it doesn’t appear that that agreement is being utilized by the Fullerton Fire Department to its fullest intent. In other words, Placentia’s Fire Department is not being called to assist the residents of Fullerton when we are clearly identified as being closer and available to assist or wherein there’s a need for extra support. In the spirit of the modern fire service, which is known as ‘calls without borders,’ we are supposed to assist residents with the closest available unit with the fastest available response time, regardless of whether they are in Fullerton, Brea, Yorba Linda or Anaheim. This is the system being used throughout Orange County and the nation, and yet it’s not being used locally, to the detriment of the public we took an oath to protect.

What makes this more egregious is that several Chiefs have referred to Placentia as a ‘black hole’ from an operational standpoint. Which translates to ‘don’t call Placentia unless you absolutely have to because we (and our fire unions) don’t like their model.’ This is disturbing behavior from a Command Officer or anyone that is in the business of the fire service.

In OCFA’s case, although their model relies heavily upon auto/mutual aid, OCFA has outright refused to contact Placentia Fire for auto/mutual aid calls. And when they have, they have cancelled those calls very quickly, meaning Placentia never goes into Yorba Linda to assist any more. This is despite the fact that our station on Valencia provided 85% all mutual aid calls between Placentia and Yorba Linda just one year ago to assist Yorba Linda residents. What this translates to is OCFA instead calling Anaheim, Brea and Fullerton for auto/mutual aid, which causes them to leave their cities exposed while they traverse Code 3 all the way through Placentia enroute to a call in Yorba Linda.

This ultimately and undoubtedly has resulted in longer response times by several minutes for the residents of Yorba Linda from just one year ago, all simply because of their refusal to contact us for assistance, nor the other agencies demanding of OCFA to use the system as was intended. When lack of oxygen to the brain for more than four minutes occurs, this can result in brain damage. So when we say minutes count, they do and when anyone, regardless of title, rank or authority plays games with people’s lives, they should be held accountable for such actions or reevaluate the oaths that they took as first responders in protecting people.”

Elected officials in neighboring cities should carefully consider what’s happened in Placentia. According to evidence gathered so far, they have saved money, they have improved service, and in response, neighboring fire departments have incurred increased costs and endangered lives as a consequence of their resistance to Placentia’s innovations. Given these successes, elected officials not only near Placentia but throughout California should carefully consider what’s happened in Placentia.

In evaluating how Placentia’s model might be emulated in other cities and counties in California, local elected officials should recognize there are two very distinct avenues of innovation. One involves exchanging defined benefit pensions for 401K plans, which is a significant source of savings. When Placentia took their firefighters out of CalPERS, the union controlled state legislature responded by passing AB 2967, which forbids agencies from exempting employees from CalPERS contracts. But that law does not take effect until January 2021, and it may be possible that CalPERS client agencies can preserve their rights to opt out of CalPERS in the future if, before December 31, 2020, they submit a notice to CalPERS that they intend at some point in the future to provide services using new classes of city employees.

The significance of this should not be understated, because it isn’t just fire departments that could be affected. The CalPERS system, along with most of California’s state and local government employee pension plans, continues to increase its required annual contributions from employers. But if these employers preserve their right to eventually reclassify city employees out of the CalPERS system, from firefighters to sanitation workers, there is a chance they could avoid being financially swamped in the future. On the other hand, statewide, systemic reforms to California’s public employee pensions is still a possibility. But meanwhile, local governments should have their attorneys investigate the fine print in AB 2967. Simply sending a letter to CalPERS by 12/31 might save millions in the future.

Regardless of whether or not cities and counties can get their pension costs under control, however, they must recognize the many additional innovations that saved money while improving the quality of service for Placentia’s new fire department. In a three part report published by the California Policy Center earlier this year (part one, part two, part three), Placentia’s many operational changes are described in more detail. To summarize two of the highlights, by using a contract ambulance service and by getting overtime costs under control with part-time and volunteer firefighters, Placentia has logged savings comparable to those savings realized by opting out of CalPERS.

In this time when government officials and vocal activists continually remind us all of the opportunity that the COVID-19 pandemic offers for a complete societal “reset,” it is interesting to wonder why such grand reset plans aren’t being extended to the rules and procedures and operational models that govern the public sector.

California’s firefighters, along with all public servants in California, are urged to look at innovations such as what Placentia has done, and recognize that these paradigm shifts are being attempted in the interests of all of California’s citizens, during difficult times. They should use their considerable political clout to offer mutual aid in support of this process.

This article originally appeared in the California Globe.

 *   *   *

California Voters Approve Billions in Local Taxes and Borrowing

In March 2020, for the first time in a generation, Californian’s did not approve the overwhelming majority of new tax and bond proposals that were put before them. Out of 125 proposed local bonds, only 31 percent passed; out of 111 proposed local tax increases, only 41 percent passed.

Early returns from the November 2020 ballot show Californians have snapped back towards approving the vast majority of new local taxes and borrowing. As shown on the table below, of the 46 proposals to issue new bonds that have been decided so far, 89 percent passed, and of the 161 proposals to raise local taxes that have already been decided, 82 percent passed. 

Apparently the strong rebuke voters sent the borrow and tax lobby in March 2020 was a blip. The reasons people vote for new local taxes and borrowing are known: it’s for the children, it’s for the seniors, it’s for safety. The mystery isn’t why new local taxes and bonds are approved in overwhelming percentages by California’s voters. The mystery is whatever happened in March 2020 to dissuade them.

This November, along with the perennial appeals to voter concern for children, seniors and public safety, add the massive boost to targeted ballot harvesting facilitated by universal mail-in ballots, and probably a general recognition that the COVID shutdown has left public budgets a mess, which indeed it has. But what was it back in March 2020 that had voters turning down 7 out of 10 new bond proposals, and 6 out of 10 new tax proposals? What happened?

One possible explanation for the California electorate’s ephemeral rejection of more taxes and borrowing would be their dawning recognition of two simple facts: First, Californians suffer under the highest taxes and most crushing regulatory burden of any state in America. Two, California’s public employees are among the highest paid in America. Summarizing data from three recent reports on public sector compensation in California’s cities, counties, and state agencies, the  following chart shows just how much California’s public servants made in 2019:

These averages, some of which are quite stupefying, understate what public employees make in California. Missing from these numbers are the costs of properly funding retirement pensions, as well as the costs of prefunding retirement health insurance. Increase everything by around $10,000 per year to get closer to the true value of a job in public service.

Critics of compilations such as these point to the risks taken by members of public safety, or the higher than average educations required to work as a government bureaucrat. These criticisms are valid, but miss the point. The unions that “negotiated” these stupefying compensation packages with the politicians whose campaigns they funded are also able to exercise almost absolute control over what laws are passed by the state legislature, and what regulations are written and implemented by state agencies. And is the policies, union approved, enforced by California’s state and local governments, that have led to California having a punitively high cost-of-living.

It is in these unions own interest to fix this. Sooner or later – and with the COVID shutdown, sooner is here – these crippling regulations, staggering debt, and absurdly high taxes are going to throw California’s economy into a tailspin. And when that happens, and for a change, it won’t just be the vanishing middle class that suffers.

California’s economy is big and diverse. It will always bounce back. But California’s prosperity would be more evenly distributed without union inspired redistribution schemes and regulatory entanglements. The unions that run California not only need to recognize that deregulation and competition are the best ways to ensure their members continue to enjoy generous pay and benefits, but that only they have the political power to make that happen.

Someday, when things get back to normal, post-COVID, California’s voters may decide they’ve had enough of high taxes, crippling regulations, and public employees that make far, far more than the average private sector worker. They proved they still have it in them to do that, back in March 2020, before everything changed.

This article originally appeared in the California Globe.

 *   *   *

How Much do California’s State Workers Make?

Californians pay the highest overall taxes in the United States, with more to come. The Democratic supermajority in the state legislature is considering AB 1253 that would raise the top income tax rate to 16.8 percent, and AB 2088 that would impose an annual 0.4 percent tax on any California resident’s net worth in excess of $30 million.

On the ballot, voters are being asked to approve Prop. 15, which will reassess commercial properties at current market values to calculate their property taxes, and Prop. 19, which will trigger reassessments of inherited homes unless the heirs intend to live in them.

Also on the ballot in cities and counties throughout the state, are nearly 300 proposals for new taxes and bonds which, if approved, will add billions in new local taxes and tens of billions in new local borrowing.

The reasons that California’s politicians have an insatiable need to raise taxes are many and complex. But principal among them is the fact that California’s state and local government employees enjoy rates of pay and benefits significantly greater than that of the citizens they serve. With the long-term economic impact of the pandemic lockdown likely to put additional strain on public sector budgets, cutting pay and benefits must be an option along with cutting services and raising taxes.

How Much Do California’s State Workers Make?

In two earlier reports, using data provided by the California State Controller, the average annual pay and benefits for full-time county workers in 2019 was calculated, overall, to be $126,000; for full time city workers the average was an astonishing $151,000. Meanwhile, with state agency payroll data now available from the California State Controller, the 2019 average annual pay and benefits for full time state workers was $143,000.

The following table shows average full time pay and benefits, broken out by the 25 largest state agencies in terms of headcount, and sorted with the highest averages first:

The first thing to take into account when studying these averages is the fact that they understate the actual compensation these employees receive. This is because pension contributions are understated, prefunding of retirement health benefits are not included, and the value of more public sector paid days off is not taken into account.

Comparing Public vs Private Sector Compensation

In earlier reports, the (understated) average public sector compensation calculations for 2019 were compiled by select cities and counties, comparing them to the median household income for those same cities and counties. To quantify this relationship, the ratio “TC/MHI” (which stands for “Total Compensation / Median Household Income”) was calculated, with the median household income for each city taken into account as the denominator, and average public employee compensation as the numerator. If the ratio is greater than one, then the average public employee in that city is making more than the median household earns. On the next six charts, that information is presented.

The first two charts present this data for “miscellaneous” employees, which are all public employees that are not members of public safety. As will be seen, these are the lowest averages, but even in these cases, the average public sector compensation is typically more than 50 percent greater than the median household income in the same locales. Here is the data for the cities in California with the highest reported public sector compensation. As can be seen, these are some of California’s wealthiest cities:

And here is the data for the counties in California with the highest reported public sector compensation:

When comparing public and private sector compensation in California, using the available data, it is important to recognize that for four reasons, the reported disparity is understated:

1 – The unreported costs for underfunded pensions, retirement health insurance, and the value of more paid time off result in public sector pay averages that are much lower than what is actually the case.

2 – The difference between average and median compensation results among California’s public sector workers is relatively insignificant, whereas in the private sector, averages are pulled way up by a handful of very wealthy individuals. In fact, median compensation results for public safety employees are often lower than the averages for the same set of records.

3 – The comparison is between average individual earnings in the public sector and median household income in the private sector. California’s households average more than one wage earner, meaning the median (or average) individual private sector earnings are much lower than the household income.

4 – There are 2.5 million public sector workers in California, nearly 14 percent of the 18.5 million total labor force. Their compensation is included in the average household income statistics, pulling the results up higher than they would be if only accounting for private sector households.

Average Compensation for Public Safety Employees

While “miscellaneous” public employees collect pay and benefit packages that are over 50 percent greater than their private sector counterparts – much more if you take into account the reasons their compensation is underestimated – that disparity is dwarfed by the TC/MHI ratio for California’s public safety employees.

The next four charts look again at the top ten cities and counties in terms of public sector compensation, starting with sheriff compensation in California’s counties.

With California’s sheriffs and police coping with the pandemic, social unrest, and political attacks on their ability to do their job, it is not necessary to belabor their compensation issues. Especially since police and sheriff compensation in California is consistently and significantly lower than firefighter compensation, in spite of their jobs delivering more stress, harder work, and equivalent levels of on-the-job injuries and fatalities.

What should be observed, however, is the fact that overall, police and firefighter compensation are at levels that leave very little flexibility to cope with current and future challenges to public safety. Consider the City of Berkeley (below), where the average full-time police officer earned pay and benefits of $280,000 per year in 2019, 3.7 times the median household income in that city.

The next table shows California’s top ten counties for firefighter compensation. Notably absent is San Mateo County, and the reason for that bears further explanation. Unlike sheriffs, for which every county has a department, many fire agencies exist as special districts that are either fully independent or partially independent of county administration. In California, in addition to city fire departments and county fire agencies, there are 102 fire protection districts or fire authorities. In San Mateo County, individual city fire departments provide a large percentage of the firefighting capacity.

When it comes to public sector compensation in California, no job category is more lucrative than working as a firefighter in a California city. The next chart shows average total compensation for the ten highest paying cities in the state. Every one of them report average pay and benefits in excess of $250,000 per year, bearing in mind, again, that the totals do not take into account the true cost to taxpayers to pre-fund their pensions and retirement health insurance benefits.

The intended message underlying the presentation of all this compensation data is that California’s local governments cannot hope to weather the economic storms that have just begun unless they cut pay and benefits, along with cutting headcount and cutting services. While making less is never palatable to those affected, it may be more digestible than coping with inadequate human resources to cope with challenges to the public, whether they’re fires, unrest, or social hardship.

Lower pay and benefits to public employees might also trigger a long overdue political awakening among these people, whose unions are largely responsible for promoting politicians and policies that have imposed on Californians the highest cost-of-living in the nation. Perhaps public employees could afford to make less, if they made less, because they’d start supporting politicians that would create more competitive, affordable markets for housing and energy.

As noted in several reports published earlier this year, one city in Orange County, Placentia, was able to put their fire department onto a financially sustainable path by breaking free of the Orange County Fire Authority. Instead they formed an independent fire department, where they dramatically reduced operating costs through the use of trained volunteers, hiring part-time firefighters to reduce overtime costs, contracting with a private ambulance service, and replacing pensions with a 401B defined contribution plan. The performance of this innovative fire department going forward should be closely watched.

There are analogues to what Placentia did with fire protection services across all public sector disciplines. Where are job descriptions too narrowly defined? Where do opportunities to contract with private sector services make operational and financial sense? What services and functions can be eliminated, such as the ridiculously bloated administrative overhead in public schools?

Asking these questions is unpleasant. Implementing them is hard. But California’s public agencies need to think creatively, and make some hard choices, because now more than ever, it is in the public interest.

This article originally appeared in the California Globe.

 *   *   *

BART Faces Financial Reckoning

Of all the public agencies facing financial challenges as a result of the COVID-19 pandemic, public transit has taken the biggest initial hit. The reasons for this are obvious: when there’s a lockdown and businesses are closed, commuters stay home. And of those still fortunate enough to have places to go, few want to board busses and trains where they risk heightened exposure to contagions.

Northern California’s biggest transit system is the Bay Area Rapid Transit District, commonly referred to as BART, with operating expenses of nearly $1.0 billion per year. In good years, operating revenues – primarily fares and parking fees – never covered more than around 75 percent of operating costs. But that was back in 2016, when ridership peaked, at around 435,000 per weekday, whereas pre-COVID ridership in early 2020 was running around 405,000 per day. Weekend ridership had been dropping at a higher pace than weekday commuting because of board policies that tolerate homelessness, open use of hard drugs, panhandling and petty theft on the trains.

In addition, over the past four years, the BART board of directors has been giving away an increasing array of discounts at the same time as operating costs have steadily increased. There has also been increasing tolerance on the part of the board for fare evasion which lowers revenues by, depending on which expert you ask, between $25 and $50 million per year.

In April 2020, at the height of the pandemic shutdown, BART ridership fell to 6 percent of what would have been normal for that month. Today, ridership has only rebounded to around 13 percent of normal. Even the most optimistic expectations for the fiscal year ending 6/30/2021 only estimate ridership to rebound to around 35 percent of normal.

Even without COVID as an obstacle, will BART ridership ever recover from its steady decline? How many of the major San Francisco employers still attract commuters, when, for example, Schwab, Wells Fargo, and PG&E are all moving operations out of the city, and others intend to dramatically scale back in-person office work?

The financial implications of this implosion in ridership are shown on the following chart, which draws from publicly disclosed information. It doesn’t take a financial wizard to see the trend. Plummeting revenues, rising costs, skyrocketing deficits.

What BART faces in its current fiscal year, based on what may be optimistic ridership expectations, is a system that can only pay for 11 percent of its operating costs through operating revenues. This isn’t nearly enough to allow the normal state and local tax subsidies to cover the difference. To cover this shortfall, BART, like most public agencies in California, is looking for federal bailout funds. They have already received $377 million of federal subsidies, and they’re going to need at least another $230 million just to get through the next 18 months. But what if BART experiences a sustained drop in ridership? The assumptions that governed planning and management of the BART system have fundamentally changed, probably forever.

BART’s Financial Challenges Must be Faced

The BART system has always relied on subsidies to fund their operations. That is considered normal for public transit agencies. But these subsidies have enabled BART management to avoid making tough choices to improve the efficiency of their operation. And the actual cost for BART is not only based on their operating budget that currently sits at around $850 million per year, but its annual capital budget that always exceeds $1.0 billion per year. And 95 percent of BART’s annual capital budget typically comes from taxpayers.

As with most public agencies, pay and benefits are the most significant cost variable. BART’s direct employee costs including benefits during 2019, based on data reported to the State Controller, were $623 million, including over $72 million in overtime. Based on information provided by BART to the State Controller, in 2019, the average pay and benefits paid to a full time BART employee was $163,000, not including payments necessary to reduce the unfunded pension liability.

Making up for years of inadequate pension fund contributions is an expensive undertaking. As of 6/30/2019 (the most recent data available for BART’s safety and miscellaneous employees), BART’s unfunded pension liability stood at $833 million dollars. CalPERS’ own data projects an unfunded payment from BART in the 2020-21 fiscal year of $59 million. Add that to the direct employee pay and benefit costs to get a more accurate estimate of personnel costs.

It would take more than a casual look at these averages to fully understand where there might be room for, at the very least, a freeze in pay and benefit increases of any kind. This sort of analysis could be performed with most of the BART positions, by comparing them to what, for example, people with similar job descriptions earn while working for Amtrak, or other railroad operations in California. If there is to be any appropriate time for making this sort of tough analysis, now would certainly qualify.

BART Oversight and Management is Lacking

It is difficult to ascertain who exactly runs BART. The board of directors consists of 9 part-time positions. The individuals occupying these elected positions contend with low voter awareness, and hence are often dependent on funding from the unions representing BART employees to pay for their political campaigns. In this current election season, both the SEIU and AFSCME, representing bargaining units at BART, have contributed to reelect their favored candidates.

When examining the posted biographies of BART’s current board of directors, it is fair to wonder what qualifies them to manage a transit organization with a combined operating and capital budget that exceeds $2.0 billion per year. Without dwelling on the publicly available details, one must wonder why board members whose primary career experiences were as community organizers, homeless activists, racial justice advocates, open space preservationists, cycling aficionados, and similar non-financial pursuits, are qualified to negotiate with the unions that funded their political campaigns. There is only one former CPA on the nine-member board, hardly constituting a majority.

Meanwhile, the actual governing majority of board members are deferring discussions as to how to fill more projected deficits until after the November 3 election. But when will BART’s board members step up and address systemic management failures? The COVID-19 shutdown may have brought the consequences of mismanagement to an early crisis, but even if there’s a bailout and reopening, the crisis will persist. Without major restructuring, BART is not sustainable. For example:

  • The board needs to right size the services and the top management overhead.
  • The system needs to divest of non-transit activity such as developing low-income housing on BART property.
  • They need to prioritize their transit projects and rethink their level of involvement in major proposed expansion projects.
  • They need to renegotiate the work rules that have enabled BART employees to manipulate their schedules to maximize overtime.

Three of the public employee union contracts expire in June 2021. Negotiations to renew these contracts are already underway. If BART’s board of directors is serious about restoring any sort of financial sustainability to their system, all contract provisions should be subject to negotiation.

In the current contract negotiations, if BART had a financially literate board of directors that properly understood that their job required them to prioritize the interests of fare paying riders and taxpayers, union rumblings of a strike would be met by the respectful suggestion to “go ahead.” With BART ridership at a small fraction of normal, and a new world dawning on the other side of the COVID pandemic, now would be a perfect time to shut BART down and redesign the entire system.

This article originally appeared on the website California Globe.

 *   *   *

“Public Information” to Promote New Taxes, Paid for by Taxpayers

Did you know your taxes are being used to advocate for more taxes? Well, not exactly. It’s against the law for public agencies to engage in “advocacy.” The people running these agencies who want to raise your taxes may only spend public funds in order to “communicate” with you about their proposals. And so they “communicate” good and hard. And then you vote.

An example of this, and there are many, is the City of Fullerton.

To cope with a projected $7.9 million deficit, the Fullerton City Council has approved a 1.25 cent sales tax increase, which voters will either approve or reject this November. The city expects to raise $25 million per year through this tax. At first glance that appears to be overkill, but first glances can be deceptive.

For starters, nobody knows how far revenue will drop. The pandemic shutdown is entering its eighth month with no end in sight. And while tax revenue falls across the state, pension costs continue to rise. For Fullerton, this is documented in the CalPERS actuarial reports for the city’s miscellaneous and safety employees. These reports, the most recent available, were released in July 2019, well before COVID-19 burst the global investment bubble.

The reports show that Fullerton was already pouring $25 million into CalPERS in the current fiscal year, an amount projected to rise to over $33 million by 2025. And with 70 percent of that going into public safety pensions that were only 64 percent funded as of June 30, 2018, who knows how much those payments are going to rise.

The initial intention of the city council was to propose all of the funds raised by a sales tax increase would go to pay for new and upgraded infrastructure, but a special infrastructure tax would require a 2/3 approval by voters, and the city’s polling indicated that was an unlikely outcome.

Which brings us back to the topic of cities using taxpayers money to research voter sentiment, which they then use to tailor “public information campaigns” to “educate” voters on their new tax proposals.

When Do “Public Information Campaigns” Become Political Campaigns?

In his syndicated column entitled “Local tax hikes cleverly packaged,” two years ago, Dan Walters wrote “Local governments cannot, by law, directly finance campaigns to win voter approval of new taxes. However, local officials can – and quite often do – hire consulting firms to test voter sentiment in advance, design tax proposals to give them the best chance of winning approval, and design supposedly educational mailers and other materials that portray the taxes in positive terms.”

The difference should be obvious, but in practice it’s not. When you engage in a political campaign, you are explicitly supporting a particular candidate or ballot measure. When you are “communicating,” you are compelled to limit yourself to presenting objective facts and information to the public; you cannot take a stand for or against a candidate or ballot measure.

The problem arises because California’s cities and counties are so desperate to raise taxes and secure additional bond financing, their taxpayer-funded “communications” efforts vs. political campaigning is a distinction with almost no difference. After all, it is merely informative to tell voters that the city needs more money to hire more police and firefighters so octogenarian widows aren’t sexually assaulted in their burning houses. These sorts of messages are not political ads, they’re just “communications.”

And through that massive loophole pours countless millions of taxpayers money every election season, out of city or county coffers and into the hands of communications consultants.

Walking this fine line requires cities to make sure they communicate without advocating. But why on earth would a city council spend city funds to communicate information that would discourage voters from voting in favor of a tax increase that they have themselves approved for the ballot?

Fullerton, unsurprisingly, wants to “communicate” with voters about their proposed sales tax increase. To manage their communications, they have accepted a proposal from TBWBH Strategies, a “non-partisan strategy and communications consulting firm specializing in bond, tax and other public finance ballot measures supporting public programs, services and facilities.”

On the homepage of TBWBH’s website, note how they carefully they have worded the description of their primary services, which they characterize as “Revenue Measure Consulting for Public Agencies.” Notice that nowhere does this description actually say they engage in advocacy:

“TBWBH Props and Measures is a strategy and communications consulting firm specializing in developing revenue measures for the ballot and implementing informational communication strategies to meet your funding needs. Our work has generated billions in revenue for quality public services, programs, facilities and infrastructure in communities throughout California and the nation.”

If you scroll a bit further down TBWBH’s homepage, after a slide deck that depicts the many sorts of public agencies that TBWBH works with, there is a description of additional services they provide, characterized as “Winning Revenue Measure Campaigns.” The description reads:

“TBWBH Props and Measures also advises advocacy campaigns supporting revenue measures to develop and implement strategies that secure the votes needed to win. Even on tough supermajority revenue measures, we maintain a win rate of over 90%.”

All of this is perfectly legal. To engage in a bit of hyperbole, merely to make perfectly clear what’s really happening here, city councils hire firms like TBWBH to do “revenue measure consulting” that result in taxpayer funded “information communications strategies,” then the public sector unions who arguably control these city councils –  unions that need all that money to raise their pay and fund their pensions – also hire firms like TBWBH, where the advocacy side of the house wages “winning revenue measure campaigns.”

To keep up appearances, one would expect two firms to be hired. One by the city. A different one by the unions. But who knows? And why bother, if it’s all legal?

Do Public Agencies Ever Cross the Line into Advocacy?

The somewhat ambiguous criteria for what constitutes “advocacy” renders this an extremely difficult question to answer. But sometimes public agencies and their communications consultants cross a line obvious enough to earn them a slap on the wrist. But it doesn’t happen very often, and the consequences are minimal.

For example, on August 21 of this year, Los Angeles County settled a claim that it used tax funds to campaign for tax hikes. As reported by LAist, “In 2017, L.A. County spent nearly $1 million in public funds on a campaign to pass Measure H, a quarter-cent increase in the sales tax to fund new services for homeless people. It blanketed radio and TV airwaves, and ran print ads in newspapers in English and Spanish with the slogan ‘Real Hope, Lasting Change.’ Now, county taxpayers are on the hook for another $1.35 million to settle legal complaints about the campaign, based on state law which says governments may not spend taxpayer funds to advocate for a tax increase.”

The scope of this ruling is laughable. Measure H, which was a voter-approved 1/4 cent sales tax increase, will generate an estimated $355 million a year for ten years to fight homelessness. As an aside, that is more than enough money to cure homelessness in Los Angeles County if they’d restore laws and penalties to curb vagrancy, petty theft, and public intoxication, and build supervised tent shelters in inexpensive parts of the county. But instead, anything goes in woke Los Angeles, and corrupt developers are making billions, building “homeless supportive housing” at an average cost of $500,000 per unit. Measure H, like most homeless initiatives in woke locales across America, is a lucrative scam for developers and a magnet for more homeless. This is a failed model in a failing county.

To the point, however, a one-time $1.35 million settlement for violating campaign finance laws amounts to nothing, when the fruits of the illicit advocacy campaign total $355 million per year.

The plaintiff in the lawsuit leading to the settlement with Los Angeles County was the Howard Jarvis Taxpayers Association. Jon Coupal, HJTA president, was quoted in LAist saying that next time “We’re going to put bounties on these individuals who engage in this activity.” When asked to clarify what he meant by that, Coupal, in an email, said “we acknowledged that, despite the record fine imposed against LA County, some public entities might still calculate that such fines are worth the return on investment. For that reason, HJTA will, in the most egregious cases, pursue personal liability against the elected officials and public employees who authorize such illegal expenditures. Such a remedy has been recognized by the California Supreme Court as a legitimate penalty.”

Watch out, public agencies. The watch dogs are going to bite harder next time. And they are watching Fullerton very closely.

When reached for comment on the common practice of public agencies using taxpayer sourced funds to “communicate” to voters about tax measures they have proposed, Jon Fleischman, a political strategist with Fleischman Consulting Group and the publisher of the FlashReport, had this to say:

“This practice of spending taxpayer dollars to hire professional public relations firms to advocate for the passing of tax increases is pure corruption. There is an appropriate expectation that when measures are before the voters, those who support and oppose them will raise money and spend money to influence voters, and that those activities will be publicly reported. Here you have voters who do not support higher taxes having their own tax dollars used to influence the outcome of the vote, all while shielding this electioneering from public disclosure as campaign related expenditures.”

Steps to Prevent “Public Education” That Supports New Taxes

The California Policy Center issued a policy brief in 2017 that included sample language for a local ordinance that would make it much harder for public officials to engage in “education” campaigns relating to new tax and bond proposals. The operative paragraphs from that sample ordinance are as follows:

Article 1. This city/county will not use public money – either internally, through its own staff and treasury, or externally, through the hiring or use of outside vendors – to engage in public education; public opinion polling or studies; or communications intended or may seem to be intended to determine the outcome of political campaigns.

Article 2. This city/county will fully disclose and make available – online and in public meetings and in public places – any documents, including contracts, communications, or proposals with vendors and/or staff which touch on public education; public opinion polling or studies; or communications which might seem to a reasonable person designed to determine the outcome of political campaigns.

Article 3. Every city/county official – elected, appointed or in any way employed with this city – is duty-bound to declare publicly a violation of this resolution.

Article 4. This city/county will never use force – including lawsuits – to derail an attempt to disclose the potential violation of this resolution.

The next few years are likely going to be more financially challenging for California’s cities and counties than the last few years. Higher taxes burden private citizens that are already harmed by the economic slowdown. Rather than raising taxes, local elected officials, and the public sector unions that influence them so much, need to work to make government more efficient. It can be done.

This article originally appeared on the website California Globe.

 *   *   *

A Recommendation for the California Teachers Association

This week a fascinating article on the website of the Education Intelligence Agency revealed that the California Teachers Association, one of the most powerful labor unions in the world, is itself having labor problems. Moreover, the labor problems they’re encountering are because they’re trying to be fiscally responsible.

Setting aside for a moment all the grievances that education reformers and concerned parents may have towards the CTA, what they are experiencing right now is an opportunity for a broader consensus to form on one specific and very big issue; pension reform.

It shouldn’t be necessary to explain that California’s public employee pension systems are in trouble. Back in 2019, despite still being in a bull market lasting over a decade, most of California’s public employee pensions systems were already challenged; CalPERS reported their system to be 71 percent funded as of 6/30/2019, and CalSTRS reported an even more dismal 66 percent funding.

And then came COVID. Despite the COVID shutdown affecting at most half their fiscal year, CalPERS reported earnings for the twelve months ended 6/30/2020 of only 4.7 percent, and for the same period CalSTRS reported earnings of only 3.9 percent. To say the bull market is over is inadequate. We are at the end of an era.

The CTA can lower their pension formulas to CalSTRS levels

Someone unfamiliar with the CTA’s employees might assume that these union professionals representing teachers receive the same pension benefits as the teachers they represent. Not so. The following chart shows the pension benefit plans for teachers who are part of the CalSTRS system.

The above chart, taken from the CalSTRS website, offers a fairly typical snapshot of how defined benefit pensions work. As noted in the overhead caption, “service credit” refers to the number of years an employee worked. The “age factor” or multiplier, is used to calculate the pension. The chart shows two cases, columns 1-2 for employees hired before 2013, columns 3-4 for employees hired during 2013 or afterwards.

As can be seen, the baseline retirement age for pre-2013 CalSTRS participants is 60, and for post-2013 participants it is 62. In both cases, if they retire in their baseline year, their pension is their final pension-eligible salary times the number of years they worked, times 2.0 percent. If they retire earlier, that 2.0 percent multiplier is lowered, and if they defer retirement, the multiplier is raised. This is done in an attempt to equalize the overall value of a retirement. If you retire early, you collect less money per month for a longer period of time. If you retire late, you collect more money for a shorter period of time.

The CTA’s Own Union Employees Have a Better Pension Formula than CalSTRS

The CTA may be a labor union, but the professionals who work for the CTA are themselves represented by a union, the “California Staff Organization” (CSO). As videos on their website attest, the members are upset at changes the CTA is proposing to its pension plan.

The pension system for CTA employees is the “California Teachers Association Employees’ Retirement Benefits Trust.” As disclosed to participants in 2019, this pension system is entering a “critical” status which under federal law means it will have to adopt a “rehabilitation plan” to restore the plan to good financial health.

As a digression, the CTA’s pension system, unlike CalSTRS and CalPERS, is subject to federal oversight under the Employee Retirement Income Security Act of 1974 (ERISA). Why public employee pension plans are exempt from ERISA is indefensible, but that is a discussion for another day. Under ERISA, the CTA’s plan is considered in critical condition even though it is 75 percent funded, better than CalPERS or CalSTRS. Let that sink in.

To financially rehabilitate their pension system, the CTA is proposing an assortment of revisions to the benefit formulas, presumably in search of a combination of changes that will be accepted by their employee union and also pass review by federal regulators. But what are the benefits today?

To answer this, a good source are the FAQs released by the CTA to describe the proposed changes to their members. According to this document, question 12 describes the current plan. It offers a 3.0 percent multiplier at age 65, which is better than what CalSTRS teachers get – referring to the above chart, the CalSTRS multiplier at age 65 in only 2.4 percent. But that’s not the whole story.

CTA employees also get what is called an “early retirement subsidy,” which in effect means the 3.0 percent multiplier is used at any point after age 50. This is an incredibly generous value. Eliminating it retroactively would indeed have a dramatic impact on the expectations of CTA employees nearing retirement. Eliminating the subsidy just for future work would still be a significant change, one that would certainly be easier to defend as equitable.

But why, thanks to the “early retirement subsidy,” are CTA employees getting a 3 percent at 50 retirement package, when the teachers they represent were getting a 2 percent at 60, and only 1.4 percent at 55? Why are CTA employees earning a pension benefit literally twice as valuable as the teachers they fight for?

There’s obviously a lot more to this story. Maybe taking into account other factors, such as the level of employee contributions to their pensions via payroll withholding, the CTA pension benefit isn’t twice as valuable as the CalSTRS benefit for teachers. That’s fine. Taking everything into account, it’s still a lot better.

Not all advocates for pension reform call for elimination of the defined benefit plan in favor of a defined contribution plan. A defined contribution plan offers no guarantees to retirees, because only the employer’s contribution is fixed and guaranteed. If a person happens to retire during an extended period of market losses, or happens to live a longer than average life, they’re screwed with a defined contribution plan. This is why a defined benefit retirement plan, properly managed, is worth fighting for.

ERISA is a valuable tool to ensure defined benefit pensions stay within reasonable financial bounds. When the CTA’s pension plan strayed into financially unsustainable waters, ERISA came calling. Now the CTA management and workforce can use this opportunity to ask themselves: why on earth did we think we were entitled to a defined benefit retirement plan so much better than the teachers we represent?

The good news for CTA: If they lower their retirement benefit formulas to conform exactly to what CalSTRS offers, their funded status will likely crawl out of critical condition. And if they had a financially healthy retirement plan that was identical in structure to the CalSTRS plan, they would acquire at least some moral credibility when advocating to preserve CalSTRS benefits.

This article originally appeared in the California Globe.

 *   *   *

The Financial Power of California’s Government Unions

There is no special interest in California that wields more influence over state and local politics than public sector unions. At every level of government, from the office of the governor to a school board managing a district with only a few hundred students, public sector unions are omnipresent. With rare exceptions, to defy their agenda is certain political suicide.

The reason for this power is money. Lots of money. Every two-year election cycle, not millions, but hundreds of millions of dollars are spent by California’s public sector unions to support or oppose candidates, campaign for ballot measures, lobby the legislature, and pay for public relations campaigns. While wealthy individuals or powerful corporations may at times challenge these unions, their concerns are narrow in focus. Nothing matches the perennial torrent of public sector union money; the opposition may stir up a flash flood, but these unions are the Amazon.

Twice in the past five years the California Policy Center has attempted to estimate just how much money public sector unions collect and spend each year. In 2015, a rough top-down estimate that used US Census Bureau data on union membership and general assumptions on the average union dues payment came up with $1.0 billion per year. In 2018, exercising an abundance of caution, referring to the 990 forms that unions file with the IRS, as well as researching membership information that is often provided by the unions on their websites, the total public sector union spending estimate was $800 million per year.

This time, using the same methods as 2018, but going into somewhat more detail, the new estimate is $921 million. It should be noted that available information online is usually about 18-24 months behind. For example, our 2018 report referenced Form 990s that were filed for 2015. This 2020 report used Form 990 data for the year 2018, the most recent currently available.

The fact that data presented here represents 2018 numbers raises an important question: Has the Janus decision, which found that the application of public sector union fees to non-members is a violation of the First Amendment, had any effect on public sector union revenue and membership? Because Janus took effect in mid-2018, the results shown here may only serve as a baseline. Form 990s for 2019 will not be available to the public for another year.

Moreover, unless the trends in total revenue estimates show truly dramatic changes, which is unlikely, there are too many variables at work to know what may be generating the variance. If the numbers are up, would they have been up higher without the Janus decision? Will any downward results in 2019 merely be the impact of unions losing non-members who still had to pay agency fees, or would some of the downturn be the result of losing members? How will the bureaucratic obstacles put up by the unions delay individuals from exercising their new rights under Janus? And how would one account for new bargaining units, such as the 45,000 child care providers who in July 2020 voted to become new AFSCME members?

Much of this discussion, however vital, falls outside the scope of this analysis. Here then is an assessment of just how much public sector unions collected in 2018.

PUBLIC EDUCATION UNIONS

The biggest public sector union in California, by far, is the California Teachers Association. From their website’s “About Us” page, the CTA’s declared membership is 310,000, down from the “Fact Sheet” they’d posted two years ago (since removed) which declared a membership of 325,000. On the surface, this may suggest the CTA has lost members, but in reality what was the CTA’s loss was another union’s gain.

As reported by EdSource in August 2019, the faculty associations representing 19,000 staff working in the Cal State University System voted to “disaffiliate” from the CTA. The CTA, for its part, claims new recruits have made up for this. Whatever the net effect will be, during 2018 these Cal State workers were still part of the CTA, so 325,000 remains a valid membership estimate for that year.

Using an average annual dues estimate of $1,040 per member, which is based on an analysis published in June 2018 in LA School Report, the CTA and all of its local affiliates had an estimated total dues revenue in 2018 of $338 million. The CTA also had “other income” in 2018 of $18 million, which brings their total revenue estimate up to $356 million.

A distant second to the CTA, but still one of the biggest public sector unions in California, is the California Federation of Teachers. Like the CTA, the CFT is comprised of separate local and regional affiliates, making the challenge of estimating their consolidated revenue best approached by multiplying their average dues by their stated membership. According to their “About Us” page, their membership is 120,000, and their average member dues, reputedly somewhat lower than the CTA at $900 per year, puts their total revenue at $108 million.

The California School Employees Association, which according to their “About Us” page has a massive membership of 250,000 school support staff, reported on their 2018 Form 990 total revenue of $81 million. This implies an average annual dues of only $327 per member, which seems low. Without reviewing the 990s for all of the CSEA affiliates, and accounting for the net effect of all internal transfers of funds, it is impossible to discern a more accurate number for CSEA. It may be that the number of CSEA members is a relatively low percentage of the number of people represented in their bargaining units.

PUBLIC SAFETY UNIONS

The decentralized nature of most of the major public sector unions in California makes any reasonably accurate but rough estimate dependent on two variables – total membership and average dues per member. To arrive at the number of members of police unions in California, we relied on an October 2018 Public Policy Institute of California study “Law Enforcement Staffing in California.” Quoting from the study:

“In 2017 there were more than 119,500 full-time law enforcement employees in California; roughly 78,500 were sworn law enforcement officers (with full arrest powers) and 41,000 were civilian staff.” We are assuming that 100 percent of the sworn law enforcement officers are unionized. If this is incorrect we would appreciate the opportunity to know the accurate percentage.

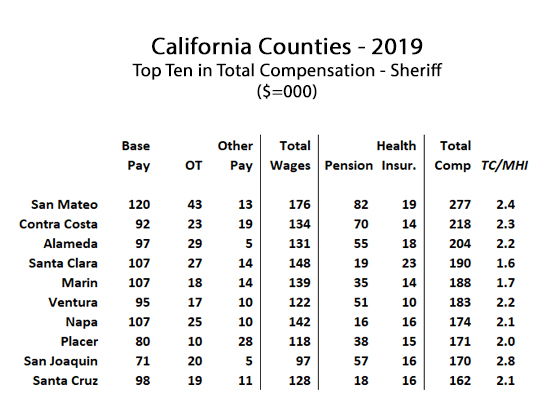
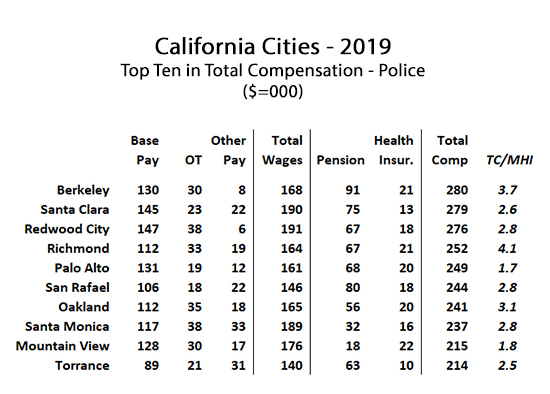
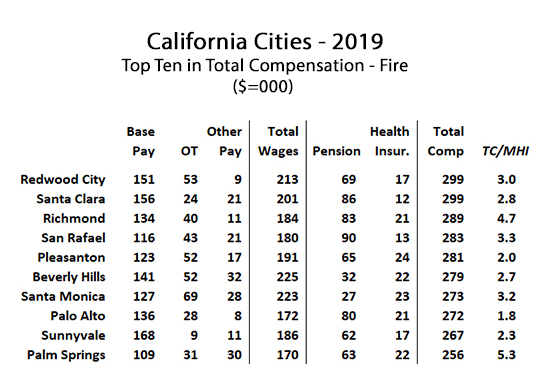
To arrive at the average union dues paid by California’s police officers, we reviewed the Form 990s for the unions representing sworn police officers in California’s ten largest cities. On these forms the “revenue from dues” is a separate line item. We then collected, for each city, the number of police officers on the force. In most cases, this information was available from the city websites, in a few cases, we had to rely on news reports, and in two cases, we called the police dept. in those cities and asked them. Using this method, the weighted average annual union dues we calculated was $1,340.

The product of average police union dues of $1,340 and 78,500 sworn law enforcement officers yields an estimated total revenue for all police unions in California of $105 million per year.

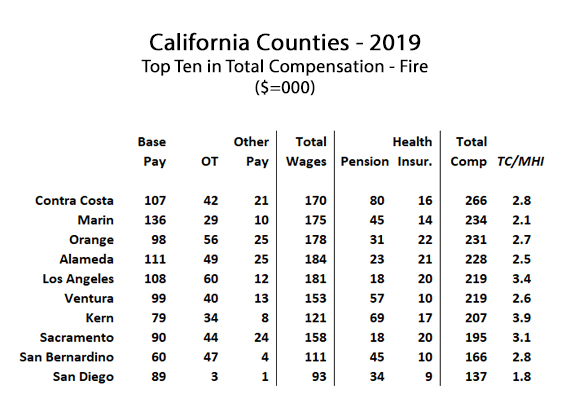
A similar method was used to estimate the total dues collected by California’s many firefighter unions, mostly local affiliates of California Professional Firefighters. On its “About CPF” page, the California Professional Firefighters claim membership of 30,000. Applying the same average annual dues assumption we used with members of police unions, $1,340 per year, we estimate the total dues collected by firefighter unions from their members at $40 million per year.

California’s prison guards are represented by the California Correctional Peace Officers Association (CCPOA), a centralized union which reported on its Form 990 total revenue in 2018 of $30 million. This is consistent with a membership of around 31,000, implying average dues of $983 per year.

OTHER PUBLIC SECTOR UNIONS

Two very large public sector unions that belong in any analysis of public sector union revenue in California are the California affiliates of the American Federation of State, County, and Municipal Employees (AFSCME), and the California State Employees Association which includes the massive SEIU Local 1000.

AFSCME California includes a diverse group of “Councils” that represent an impressive variety of professions. This can be quickly appreciated by reviewing their “Who is AFSCME California” webpage. From the information on these pages, along with phone calls to some of the actual Local offices, the total number of AFSCME members in California is estimated at 220,000 people. If anything, this estimate is low, insofar as some large agencies were unable to provide membership numbers.

Because the AFSCME dues assessment varies roughly between 1.25 and 1.5 percent, because a high percentage of AFSCME’s job descriptions involve skilled professionals, and based on conversations with experts on public sector unions, we believe an average annual dues collections estimate of $600 per year is reasonable, since even at the lower withholding percentage this implies an average member income of $48,000 per year. Based on these assumptions, we estimate AFSCME California’s consolidated dues revenue at $132 million per year.

Last but not least is the California State Employee Association, which includes three major unions of active state and local government employees. The Cal State University Employees Union, which declared revenue of $7 million in 2018, the massive SEIU 1000, representing 96,000 employees with revenue of $56 million in 2018, and the smallest of the three, the Association of California State Supervisors, representing 6,500 members with an estimated 2018 revenue of $4 million.

When it comes to the possible impact of the Janus decision, the 2017 and 2018 Form 990s for SEIU 1000 offer intriguing data. In 2017, SEIU had service revenue considerably higher, at $67 million. Understanding the reason for this drop, and watching the revenue trends over the coming years for all of California’s public sector unions, should make for interesting future analysis.

CONCLUSION

As shown on the following summary chart, California’s public sector unions collect and spend well over $900 million per year, or $1.8 billion per two-year election cycle. While only about one-third of this money is spent on explicitly political purposes such as campaign contributions and lobbying, this is still a staggering amount of money. What other special interest in California is willing and able to spend $600 million every two years on political advocacy, year after year, for decades on end?

And where the spending is not declared as political, it may still have a political impact. As the plaintiffs argued in the Janus case before the U.S. Supreme Court, and in the deadlocked Friedrichs case before that, all public sector union spending is inherently political. Public education campaigns, for example, are not considered “political,” but unions rarely embark on these efforts, often at levels where they saturate California’s expensive media markets, without at least an indirectly political motivation. And what about negotiations for compensation and work rules? Aren’t these political decisions?

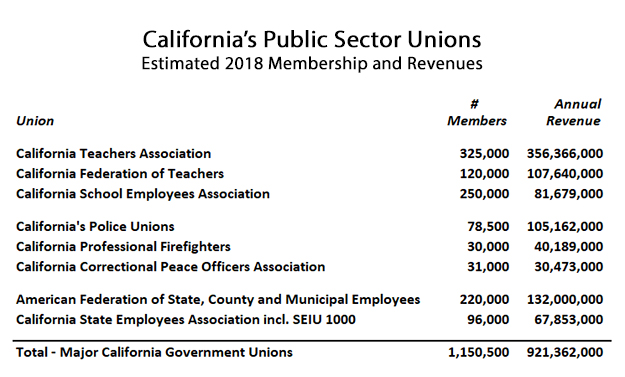
When considering the total spending estimate here, it is worth emphasizing that in most cases these estimates understate the ultimate total. In every case, the average dues we assumed for our calculations of total dues revenue were lower than what virtually all anecdotal evidence suggests. And in only one case, the state branch of the CTA, did we include “other income” apart from dues revenue. How many of these unions and their many affiliates, most of them flush with cash and other invested assets, had additional revenue beyond just what they collected from their members?

Moreover, what about the many unions we didn’t identify here, but which are active in California and, cumulatively, add significant numbers to the estimates of total members and dues collections? What about the Council of UC Faculty Associations, an amorphous group that represents potentially tens of thousands of professors, associate professors, post-docs, etc.? Under what umbrella do these bargaining units fall? Were they excluded from this analysis? Probably. And what about the California Nurses Association? How many of their members work in the public sector?

To get another glimpse of just how Sisyphean the task of identifying and tracking all of California’s public sector unions is, have a look at this website, put up by the Freedom Foundation. Scroll down this page and consider the following: Were all of these various Locals included in this analysis? Here’s your answer: No. They weren’t. There’s simply too many of them. Some years ago, a professor at Pepperdine University who was considered an expert on public sector unions in California was asked if there was an accurate compilation, anywhere, ever, showing how much, collectively, these unions rake in every year. His answer, emphatically to the negative, was too obscene to be repeated here.

If anyone wishes to undertake a comprehensive analysis of every single public sector union in California, every state headquarters, every regional council, every Local, they’re welcome to it. The reporting requirements are almost nil. Unlike private sector unions, which are somewhat more accountable due to having to file the more detailed Form LM-2 with the U.S. Dept. of Labor, the only public disclosure required of public sector unions is the Form 990, mostly used for tracking nonprofits. The diligent analyst, using Form 990s, will have fun attempting to net out the thousands of cases where funds are transferred between affiliates – dues trickling upwards to regional, state and national offices, as well as sometimes horizontally between Locals, and sometimes from the top down. Have at it.

California’s public sector unions are not only the most powerful political special interest in the state, but most of them are nakedly partisan. To have all this power, and merely use it to push for more staff, more restrictive work rules (which equates to more staff), more pay, and more benefits, that would be bad enough. Not because workers shouldn’t want to optimize their opportunities to work and live with security and dignity, but because public sector unions simply do not have to deal with the natural checks on their demands that create more balance between management and private sector unions. But with only a few exceptions – primarily among the law enforcement unions – the websites of these public sector unions read like a pamphlet describing the agenda of the Democratic party. Is this appropriate? Does this represent the membership? And even if so, shouldn’t public sector unions, with all the power they wield, be politically neutral?

A long overdue reckoning with public sector unions faces California’s electorate. It might start with the public schools, which labor under a public sector union monopoly that has nearly destroyed accountability. The CTA, for example, has endorsed the absurd goal to “defund the police.” Perhaps defunding the CTA itself might be a more appropriate way to rescue California’s disadvantaged.

But between the political reality of public sector union power, and the necessary reforms that Californians desperately deserve, are nearly one billion dollars per year of cold hard cash.

This article originally appeared in the California Globe.

 *   *   *