California Supreme Court Finally Rules on Case Affecting Pensions

On Thursday the California Supreme Court issued its ruling in the case Alameda County Deputy Sheriff’s Association vs Alameda County Employees’ Retirement Association. In plain English, this was a case where attorneys representing government unions were challenging pension reforms enacted by California’s state legislature in 2013. The ruling, which had the potential to empower dramatic changes to pension benefit formulas, was measured. But it is generally considered a victory for the plaintiffs.

Pete Constant, CEO of the Retirement Security Initiative, which advocates “fair and sustainable public sector retirement plans,” found the ruling encouraging, stating “the court has confirmed that the public interest is of utmost concern when determining whether public pensions need reform.”

What advocates for financially sustainable pensions are up against is the so-called “California Rule,” an interpretation of California contract law that dramatically limits the ways in which elected officials, or voters in a ballot measure, can modify pension benefits for public employees. The prevailing interpretation of the California Rule is that it prohibits changes to pension benefit formulas for active public employees, even for work they have not yet been performed.

In practical terms, obeying the California Rule means that whatever pension benefit package was in place on the date a public employee was hired must be maintained throughout their career. If it is changed, the employee must be given a compensatory new benefit of equal value.

Pension benefit formulas for California’s state and local public employees are typically calculated based on three variables – how many years the employee worked, how much the public employee earned in their final year of employment, and a “multiplier” that is applied to the product of these two values. For example, a public employee who has worked for 30 years, making $100,000 in their final year of work, whose pension “multiplier” was 3 percent, would get a pension equal to 30 x $100K x 3%, or $90,000.

During Jerry Brown’s second eight year stint as Governor of California, he consistently advocated for pension reform, claiming the unforeseen and escalating costs to fund public employee pensions were putting an unsustainable burden on civic budgets and taxpayers. The reform he pushed through the California State Legislature, the Public Employee Pension Reform Act of 2013 (PEPRA), was an attempt to curb what were seen as abuses in public pension systems. Passage of PEPRA immediately generated litigation by attorneys representing public sector unions.

In an earlier case decided in 2019, Cal Fire Local 2881 v. California Public Employees’ Retirement System, the court upheld PEPRA’s prohibition of the purchase of so-called “airtime,” which manipulated a pension calculation variable by increasing the number of years an employee worked.

In this case, the court upheld PEPRA’s amended definition of another pension calculation variable, how much they earned in their final year of employment. This PEPRA provision was designed to “exclude or limit the inclusion of additional types of compensation in an effort to prevent perceived abuses of the pension system.”

The various ways in which PEPRA attempted to end these practices that critics refer to as “pension spiking” have been repeatedly challenged by public employee unions in court. Relying on the California Rule, the union argument might reduce to this: “if pension spiking was a common and accepted practice at the time we were hired, then we relied on the ability to eventually spike our pensions back when we made the decision to enter public service. It is a vested right which cannot be taken away.”

The court did not agree. Buried in its nearly 100 page opinion was the following: “They [the provisions of PEPRA] were enacted for the constitutionally permissible purpose of closing loopholes and preventing abuse of the pension system… Further, it would defeat this proper objective to interpret the California Rule to require county pension plans either to maintain these loopholes for existing employees or to provide comparable new pension benefits that would perpetuate the unwarranted advantages provided by these loopholes.”

The implications for future reform are mixed. Jon Holtzman, a partner with the Renne Public Law Group and an expert on the laws governing public sector pensions, was encouraged, saying, “This is a very positive ruling. The court concluded there was not a contractual right to spiking. A more notable aspect of the decision is they once and for all dispelled the notion that if you take away a benefit that you must give a comparable benefit.”

There are two ways this ruling chips away at this core element of the California Rule. First, as noted, the court does not recognize the obligation to “perpetuate the unwarranted advantages provided by these loopholes” by providing a comparable benefit when the loophole is closed. The second way this ruling undermines the California Rule is more ambiguous.

The concurring opinion summarizes this ambiguity. Justice J. Cuellar writes “The test the court applies here is merely a specific application, fit for this situation, of a more general inquiry: whether a reduction in pension rights without any comparable new advantages is ‘reasonable’ and ‘necessary’ to further ‘an important state interest…'”

There’s a lot to unpack here. First, the ruling does not invalidate the prevailing interpretation of the California Rule, it makes clear the court is looking at a specific application – namely, what constitutes pension eligible pay when calculating a retirement pension. Secondly, it is implying that if the plaintiff can demonstrate that a provision of PEPRA, or any other pension reform that might come along, requires unnecessary or unreasonable reductions to pension benefits in pursuit of “an important state interest,” then the California Rule may still be applicable, preventing those reforms. Finally, though, what constitutes an “important state interest?”

This question awaits another court case for further clarification, and it could be the answers continue to arrive only in the context of specific applications of the question. Yet on this question hinges the ability of pension reformers to enact more meaningful modifications to public sector pension formulas. At what point does modifying public sector pensions become an “important state interest?” When they’ve become too expensive? They’re already too expensive. Or when the burden of paying them propels an agency into bankruptcy? And what if instead of bankruptcy, agencies – cities and counties and special districts – simply cut services and staff in order to cover operating deficits, and leave the pensions intact?

Pete Constant, commenting on the limited scope of today’s ruling, said “with the uncertainty we’re seeing today, this would have been a good time for the California Supreme Court to issue a broad decision.”

Carl DeMaio, the former San Diego City Councilman who has spent decades pushing for pension reform, was less subtle. In a blistering press release, he said “By crafting a narrow ruling that sidesteps the fundamental flaws with the notorious California Rule, the California Supreme Court seems hell bent on forcing California taxpayers to bear the excessive costs of unsustainable pension payouts for state and local government employees.”

They’re both right. The economic uncertainty ahead for California’s public agencies, as Constant warns, will demand further action to reduce pensions. Pension payouts, as DeMaio says, are excessive and unsustainable.

Future reforms, either initiated by the legislature, citizen initiatives, or bankruptcy courts, may have to take aim at more substantial elements of pension benefit formulas. To list just a few: reducing the multiplier for future work, reducing the cost-of-living adjustment for retirees, requiring active public employees to personally contribute more to the pension system via payroll withholding.

The ruling this week did not go far enough. But it reinforced earlier precedents that make clear the California Rule will not apply in all cases, and it left open the door to define an “important state interest” in a manner that is broad enough to empower more substantial reforms in the future.

This article originally appeared on the website California Globe.

 *   *   *

How Much Do California’s County Workers Make?

In April, with the pandemic shutdown sending California’s economy into free fall, Gavin Newsom convened a Zoom meeting with the four living California ex governors. He asked them to describe the biggest crisis they faced while in office. As reported by the New York Times, according to Pete Wilson, it was the 1994 Northridge earthquake. For Gray Davis, it was the electricity brownouts that cost him his job. Arnold Schwarzenegger and Jerry Brown both cited the Great Recession as their biggest challenge. None of them considered what they faced to be comparable to what Newsom is up against.

In June, as the lockdown eased, California’s economy started to come back to life. Maybe the damage would be contained, and maybe recovery would be swift. But when the COVID case count ticked upward in late June and early July, Newsom tightened the screws. He called his new approach using a “dimmer switch,” which would turn up or down depending on rates of positive cases and hospitalizations.

Whatever it’s called, the consequence of Newsom’s dimmer switch is less economic activity. In February 2020, California’s unemployment rate was at a historic low of 3.9 percent. Three months later, in May, it was at a historic high of 16.4 percent. As the lockdown eased, it ticked down a bit, tracking at 14.9 percent in June. With the new lockdown measures, it could go back up. One thing is certain: The pandemic shutdown is not going to end soon, as was hoped for only a month ago. California’s economy, along with the rest of the nation, is in for a long, hard slog.

The impact of an economic slump directly affects California’s state and local governments through lower tax revenues. These impacts are well documented. A projected $54 billion state budget deficit. Some California cities are seeing their tax revenue cut by over 50 percent, with no end in sight. California’s counties are equally stressed; Los Angeles County projects at least a $2 billion shortfall over the next twelve months. For an excellent and comprehensive guide to the sources of tax revenue in California, read “California’s Tax System,” from the Legislative Analyst’s office. For a summary of its contents, “Fiscal Impacts of COVID-19 and California’s Economy” from UC Berkeley is as good as any.

Rather than offer further recap of California’s imploding tax revenues, or describe the services that could be cut as a result, this series of reports focuses on the supposed third rail of California government expenditures: employee pay and benefits. Thanks to the power of public sector unions, and the politicians they control, public employee pay and benefits in California are politically untouchable. Reductions in their rate of increase, framed by union compliant politicians and press as concessions, apparently are all that political realists can hope for. But times have changed.

Last week, in part one, rates of public sector pay and benefits in California’s cities were summarized, using 2019 data that was recently posted by the State Controller’s Office. The results speak for themselves. No matter what you consider, the entire state, or individual localities, full-time non-safety workers employed by California cities earn pay and benefits that are invariably about twice what individual private sector workers earn.

For example, statewide, the average non-safety city worker earned pay and benefits of $130K in 2019, compared to $74K for the average private sector worker. For reasons described in part one, conservative assumptions were used in both cases, meaning the estimates likely understated the average value of public sector compensation, and overstated the actual average private sector compensation.

How Much Do California’s County Workers Make in Pay and Benefits?

This report calculates public sector compensation for California’s counties. It employs the same assumptions as the earlier report on compensation for California’s cities, and uses the same format. The first chart shows, by department, the compensation trends in counties between 2015 and 2019. At first glance, the increases in total compensation are fairly modest, considering four years have elapsed. Overall firefighter and miscellaneous employee compensation is only up 7 percent, and sheriff compensation is actually down 4 percent. But appearances can be deceiving.

As discussed in great detail in part one (so we won’t do it again here), starting in 2017, employers are not required to report (ref. page 10, Step B13) the contribution towards the unfunded liability as part of an employee’s pension benefit. If you just substitute 2015 pension contributions into the 2019 variables, total compensation for sheriffs in 2019 rises 2 percent to $169K, firefighter compensation rises 11% to $220K, and miscellaneous employee compensation rises by 11% to $120K.

This method still yields estimates that are misleadingly low, because pension contributions did not stay the same between 2015 and 2019. In fact, in most of California’s state and local public employee pension systems, in order to comply with new GASB regulations that have made it harder to employ creative financing gimmicksrequired pension contributions are going to double over the next few years. And that was before the pandemic slowdown negatively impacted pension systems earnings.

What California Counties Pay the Most to Their Public Servants?

When comparing public sector pay to private sector pay, it is usually difficult to come up with apples-to-apples analysis. Many public sector jobs do not have easily comparable counterparts in the private sector. And in many cases when those comparisons are made, the expectations of the job may be significantly different and the various forms of compensation offered by the job may be difficult to quantify.

These challenges, which may provide ample content for a future analysis, limit the scope of what conclusions can be drawn from the following data. But as noted, the assumptions made to estimate private sector pay are, if anything, overstating the averages. The reasons for this are discussed at length in part one in the section “How Does Public Pay Compare to Private Pay in California?”

In the tables to follow, for example, average total compensation for county employees is compared to median household income for those counties. In the far right column on each table, “TC/MHI,” the ratio of total compensation over median household income for that county is presented. It must be emphasized that any more comprehensive analysis would cause these ratios to increase. To summarize the reasons why:

Public employee compensation is understated because pension contributions are understated, prefunding of retirement health benefits are not included, and the value of more public sector paid days off is not taken into account. Median household income, on the other hand, takes into account multiple wage earners in most households. And, just to be clear about this: In the public sector – very much unlike in the private sector – median compensation never differs significantly from average, and often the median is actually higher than the average.

Taking this all into account, the next chart shows the top ten counties in California in terms of average total compensation for non-safety employees. Some of these averages are surprisingly high. The average full-time non-safety employee in San Mateo County made over $160K in pay and benefits in 2019. And while San Mateo County is among the wealthiest counties in California, with a median household income of $114K, as shown, the average non-safety county worker still made 1.4 times more than what these high income households managed to earn.

Perhaps more noteworthy, and something also reflected on the tables that report on public safety compensation in California’s counties, are the TC/MHI ratios in areas with relatively low household income. For example, the average county employee makes more than twice the household income of Riverside County, where the household income averages $64K, and also in San Joaquin County, where the household income averages $61K.The top ten counties for sheriff compensation are displayed on the next chart, with wealthy San Mateo County again taking the top spot. With California’s beleaguered police and sheriffs coping with the pandemic, social unrest, and political attacks on their ability to do their job, it is not necessary to belabor their compensation issues. Especially since police and sheriff compensation in California is consistently and significantly lower than firefighter compensation, in spite of their jobs delivering more stress, harder work, and equivalent levels of on-the-job injuries and fatalities.

What should be observed, however, is the fact that overall, police and firefighter compensation is at levels that leave very little flexibility to cope with current and future challenges to public safety. Out-of-control pension costs – for whatever reason – not only are themselves an unsustainable drain on civic budgets, but lead to equally out-of-control overtime costs because paying overtime is preferable to hiring another full-time employee with pension benefits.

As will be explained, the next chart helps to show not only the centrality of pensions as a fiscal crisis, but also the problem of even getting usable information as to their true costs. Looking at this chart, one might immediately wonder why is Santa Clara County able to pay their sheriffs on average $190K per year, whereas in San Mateo County it costs an astronomical $277K to employ a full-time sheriff? Why is Santa Clara County’s TC/MHI ratio only 1.6, when San Mateo County’s is 2.5? The answer is simple, but evidence of problems getting good data.

Observe the reported pension costs for Santa Clara County sheriffs of only $19K in 2019. Taxpayers should all be so lucky. When taking into account payments to reduce the unfunded liability, pension costs for public safety employees in California invariably average around 50 percent of base pay, sometimes much higher. San Mateo County’s average pension cost of $82K per full-time firefighter is much more representative of what it truly costs to fund these pensions. The disparity in pension costs between San Mateo and Santa Clara counties is mostly an illusion, caused by different accounting treatments.

The California State Controller needs to issue clear guidelines to local agencies regarding how to fairly allocate these unfunded liability payments to active employees and retirees, because these costs are real, and are killing civic budgets up and down the state. Until then, compensation analysts may expect barely usable, consistently inconsistent gobbledygook for what is indisputably the biggest variable affecting public sector compensation.The final table shows California’s top ten counties for firefighter compensation. Notably absent is San Mateo County, and the reason for that bears further explanation. Unlike sheriffs, for which every county has a department, many fire agencies exist as special districts that are either fully independent or partially independent of county administration. In California, in addition to city fire departments and county fire agencies, there are 102 fire protection districts or fire authorities.

Some of these fire protection districts only have one or two full-time employees, and rely heavily on volunteers. Excluding the top two, the average full-time headcount for these fire agencies is 29, and the median headcount is 8. The top two of these independent fire agencies are included in this analysis, however, because they are quite large. They are the Orange County Fire Authority and the Sacramento Fire Protection District. Their compensation records, which unfortunately are still only available for 2018, was merged into the county data table to complete this analysis as representing Orange and Sacramento counties, respectively, and both appear in the top ten.

Taking all that into account, the leader in firefighter compensation is Contra Costa County, at $266K in pay and benefits per year for the average full-time firefighter. This means that in 2019 the average full-time firefighter in Contra Costa County made nearly three times what the average household income was in that county in that year.

Missing from the top ten is San Mateo County, and the reason why can explain why other wealthy counties, Santa Clara in particular, are missing from the top ten. These counties that ought to appear in the top ten do not because they don’t have a county fire agency, nor do they have a significant special fire protection district serving them. Instead, the bulk of fire services in these counties are provided by city fire departments. In San Mateo County, for example, Redwood City’s full-time firefighters earned $276K in pay and benefits in 2019. Other cities in San Mateo County were not independently analyzed, because only the 100 largest city fire departments (in terms of headcount) were considered.

As for within Santa Clara County, city fire departments represented three of the top ten, Santa Clara at $279K (TC/MHI a whopping 3.7), Palo Alto at $249K, and Mountain View at $215K. The data on fire department compensation in California justifies a more in-depth analysis that merges the full-time compensation records from the State Controller for fire personnel in all three data sets – city, county, and special district – to come up with useful and accurate composite information on just how much they make.

The intended message underlying the presentation of all this compensation data is that California’s local governments cannot hope to weather the economic storms that have just begun unless they cut pay and benefits, along with cutting headcount and cutting services. While making less is never palatable, it may be more digestible than coping with inadequate human resources to cope with challenges to the public, whether they’re fires, unrest, or social hardship.

As noted in part one, one city in Orange County, Placentia, was able to put their fire department onto a financially sustainable path by breaking free of the Orange County Fire Authority. Instead they formed an independent fire department, where they dramatically reduced operating costs through the use of trained volunteers, hiring part-time firefighters to reduce overtime costs, contracting with a private ambulance service, and replacing pensions with a 401B defined contribution plan. The performance of this innovative fire department going forward should be closely watched.

There are analogues to what Placentia did with fire protection services across all public sector disciplines. Where are job descriptions too narrowly defined? Where do opportunities to contract with private sector services make operational and financial sense? What services and functions can be eliminated, such as the ridiculously bloated administrative overhead in public schools?

Asking these questions is unpleasant. Implementing them is hard. But California’s public agencies need to think creatively, and make some hard choices, because now more than ever, it is in the public interest. As for Newsom, for reasons that will only be judged by history as necessary or not, he has imposed a dimmer switch on California’s private sector. This “dimmer switch” is wiping out generational wealth, disproportionately destroying small family businesses, obliterating incomes, and forcing those lucky enough to still have a job to accept harder work with less pay. In these times, the public sector worker must step up to share the burden, so long as they still wish to be known as public servants, not public overlords.

This article originally appeared on the website California Globe.

 *   *   *

How Much Do California’s City Workers Make?

With the economic shutdown devastating private sector employment in California, with small family owned businesses the worst hit, how are California’s public employees doing? A recent report by NPR paints a grim picture, “Cities Have Never Seen A Downturn Like This, And Things Will Only Get Worse.” From the San Francisco Chronicle, “California cities warn of widespread layoffs and service cuts.” And from the Los Angeles Daily News, “LA County approves deep-cut budget plan, cutting thousands of positions.”

“Layoffs and service cuts.” “Cutting thousands of positions.” Is there an alternative?

In a word, yes. California’s public employers can make the same hard choices that private employers are forced to make when confronted with declining revenue. That is, they can not only layoff employees and eliminate positions, they can also cut the pay and benefits for the jobs that remain. To the extent they do this, they can keep more of their workforce employed, and they can keep more of their services intact.

In this context, it is useful to compare the average pay and benefits earned by California’s public servants to the average pay and benefits of the people living in the various cities where they work. With pay and benefit data for 2019 now available from the California State Controller for all of California’s cities, it is possible to accurately calculate compensation averages to provide current benchmarks.

How Much Do California’s City Workers Make in Pay and Benefits?

The first chart, below, shows the change in compensation in California’s cities over the past four years. As can be seen, in most categories, between 2015 and 2019 average compensation has gone up by between 11 percent and 14 percent. A notable exception to that is overtime, which is up by 21 percent for police, and 27 percent for firefighters. Another notable exception is the pension payment, which is slightly down in all three categories of employees: police, fire, and miscellaneous. The reason for this, however, is not encouraging. Starting in 2017, employers have not been required to include (ref. page 10, Step B13) the contribution towards the unfunded liability as part of an employee’s pension benefit. This merits further discussion, because the amounts are significant.

Omitting the payment towards the unfunded pension liability greatly reduces the amount of the reported pension contribution. As previously documented, employers routinely pay more towards reducing the unfunded pension liability than they pay in so-called “normal costs,” which is the amount necessary to fund pension benefits newly earned with current work. And if the “normal contribution” were ever an accurate representation of how much public employers actually have to spend to provide a retirement pension, then California’s pension funds would not have unfunded liabilities totaling hundreds of billions of dollars.

Discussing proper treatment of unfunded pension liability payments when calculating average pay and benefits for California’s city workers goes beyond the scope of this report. It would require assessing the unique liability profile of ever city considered, because, for example, there a few exceptional cities that have aggressively worked to pay down their unfunded liability. And unless literally every individual record were analyzed, active and retired, any calculations would have to rely on broad assumptions as to how much of that unfunded liability payment applies to already retired employees, and how much of the remainder appropriately ought to be included as part of the cost of an active employee’s benefits.

With respect to pensions, for this report one fact is sufficient: The average pension contribution amounts calculated are necessarily less than what these pensions are actually costing public employers and taxpayers. A lot less. This is the reason why the average pension benefit in 2019 is slightly less than the average for 2015, despite the fact that in 2018 CalPERS announced that they intended to double required pension contributions by 2024.

How Does Public Pay Compare to Private Pay in California?

It is often pointed out, with some justification, that average pay and benefits information for California’s city workers is not representative because police and firefighter compensation is included in the average, skewing it upwards. For this reason, this report shows all three rates of total compensation as separate calculations. And for all “miscellaneous” (non-safety) full-time employees working for a California city, the average rate of pay and benefits was $130,719 in 2019.

By contrast, according to the Bureau of Labor Statistics, the annual average wage estimate for all private sector occupations in California in 2019 was $61,290. Even when making generous assumptions regarding average employer benefits – 6.2 percent for Social Security, 1.45 percent for Medicare, 3 percent for a contributory 401K, and $500/mo towards health benefits – this average pay and benefits estimate still only equates to $73,817 per year.

This means that in California, non-safety city employees make at least 77 percent more than the private sector workers they serve. And in several respects, this understates the disparity. As noted, the public sector average does not include the cost to the employer of fully funding their pension benefits. It also doesn’t include the cost of pre-funding the public employee retirement health insurance benefits. And it doesn’t take into account the vast difference in average days of paid time off per year.

Normalizing for paid time off would have to include 14 paid holidays, 12 “personal days” and 20 or more vacation days as employees acquire seniority. And then there is the “9/80” program, common in California government but nearly unheard of in the private sector, where public sector salaried professionals can skip a few lunches and show up a few minutes early or depart a few minutes late each workday, and take 26 additional days a year off with pay because, every two weeks, they worked “nine hour days for nine days, then took the tenth day off.” That adds up to 72 days off per year with pay for a seasoned public sector professional.

Finally, in the public sector, the differences between “average” and “median” total compensation are negligible, with the median often actually exceeding the average. Not true in the private sector, where the impact of ultra-wealthy individuals skews the average well above the median.

For these reasons, it is reasonable to assume that non-safety public sector employees make roughly twice what private sector employees make in California. Some of this can be explained by the higher educational requirements, on average, that apply in the public sector vs the private sector. But does that disparity justify paying public servants twice as much, on average, as private sector employees earn?

Not emphasized, but worth mentioning, are the average rates of pay and benefits for California’s police and firefighters. The average full-time firefighter employed by a California city in 2019 made an astonishing 213,473, which, inexplicably, greatly exceeded the still impressive $176,226 earned by the average full-time police officer.

Often brought up in debates over public sector pay are the levels of stress and the extraordinary responsibilities confronting public servants, especially public safety employees. This is especially true at times like the present, with social unrest and a raging pandemic. This is obviously a serious concern. But the ability of public sector agencies to deliver services is heightened during these difficult times, and it is a false choice to suggest that the only options are to layoff employees and cut services.

The reasonableness of pay and benefit cuts as an option is particularly evident when comparing the situation in specific California cities.

What California Cities Pay the Most to Their Public Servants?

The next chart shows those cities in California that pay the most to their full-time, non-safety employees. Sunnyvale and Santa Clara, both nestled in the wealthy Silicon Valley, stand out from the pack, with the average miscellaneous worker in both cities earning around $200K per year in pay and benefits. Much of this is attributable to overtime, which typically is not out-of-control among miscellaneous employees.

The column on the far right of the chart helps put these public sector earnings into a local perspective. “TC/MHI” stands for “Total Compensation / Median Household Income,” with the median household income for each city taken into account when calculating the ratio. As can be seen, even though they serve these two wealthy suburban communities, Sunnyvale at 1.7X and Santa Clara at 1.8X have among the highest multiples.

When taking into account the fact that the difference between average and median compensation results among California’s public sector workers is negligible, whereas in the private sector, averages are pulled way up by a handful of very wealthy individuals, these multiples ought to indicate some wiggle room in terms of lowering the pay of public servants in these cities. That the comparison is between average individual earnings and median household income ought to further strengthen the case for lowering public pay instead of cutting public sector jobs and cutting public services.

Perhaps a particularly egregious example of inappropriate public sector compensation can be found in Oakland, where the average full-time bureaucrat earned base pay of $98,000 per year in 2019, in a city beset with high crime rates and myriad social problems. Imagine how much more effectively Oakland’s municipal government could cope with the challenges facing their city, if instead of paying their non-safety employees more than twice what the residents manage to earn, they lowered that ratio from 2.0X to, say, 1.5X, and put that many more people out on the streets to provide services to the residents?

When it comes to public safety compensation, it remains a mystery why California’s police officers make less than California’s firefighters. Both jobs carry similar levels of risk, but police, not just these days but historically as well, confront continuous stress as they deal with criminals and an often hostile public. Moreover, it can at times be difficult to find qualified recruits to join police departments, whereas fire departments never have that problem. With everything police are going through these days, it is difficult and arguably inappropriate to argue they are overpaid, but at the least in some California cities one must ask that question.

In Berkeley, for example, the average full-time police officer makes 3.7 times the median income. Notwithstanding the fact that in Berkeley, some might say the police aren’t even allowed to do their job, is it necessary for them to earn a pay and benefits package worth $280,000 per year? Many private sector critics of public pay, particularly police pay, cringe at the idea of suggesting pay cuts. But the fiscal conservatives that successfully run for local elected office are usually either well paid attorneys or prosperous businesspeople. They need to realize they are not typical; that very, very few people in private life can ever hope to earn a pay and benefits package in excess of $100,000 per year, much less $280,000 per year.

Police themselves may ask; what would it be worth to have far more members available to be on patrol? How much safer would that make both civilians and police? And what is that worth? As an aside, it has to be acknowledged that California’s liberal state legislature has made the jobs of all police in California far more difficult, with a host of laws that make it very hard to maintain public order.

Of all the public sector jobs where rates of pay have gone completely out of control, however, firefighting has to be number one. As previously noted, the average full-time firefighter in a California city in 2019 made a pay and benefits package that cost taxpayers $214,000. And as mentioned, that amount does not take into account the full cost of paying down their unfunded pension liability, nor does it take into account the cost of pre-funding their retirement health insurance. But while the statewide average is high, the average in some specific cities is astronomical. Redwood City and Santa Clara, both Bay Area enclaves of high-tech wealth, share top spot at $299,000 each. Even more shocking is the City of Richmond, also located in the San Francisco Bay Area, where the average pay and benefits for one of their full-time firefighters in 2019 was nearly five times the median household income in that city.

Local elected officials in cities like Richmond need to ask themselves one very simple, but very tough question: If they lowered the pay and benefits package for a full-time firefighter down to $200,000 per year, would they still attract qualified applicants? What about $175,000 per year? What about $150,000 per year?

One city that has gotten their fire department costs under control is Placentia, in Orange County. They withdrew from the Orange County Fire Authority to form an independent fire department that makes use of trained volunteers, part-time firefighters, and a contracted ambulance service. They also replaced their pensions with a 401B defined contribution plan. They are saving millions, and represent a model that other California cities should consider.

It isn’t necessary to be a libertarian extremist to question the pay and benefits packages that are, now more than ever, challenging the budgets of California’s cities. In fact it would run utterly counter to libertarian orthodoxy to suggest that if pay and benefits to California’s local government employees were lowered, more government employees could be hired, increasing the effectiveness of social programs and public safety.

In California, it rarely matters if a few voters are enlightened and begin to support fiscal austerity measures such as pension reform, overtime reform, or restructuring a fire department. In general the political power in California resides with the public sector unions. These unions engage in targeted campaign spending and lobbying that is perennial and relentless, forcing all other special interests to accommodate them. This is the reason that pay and benefits in California’s cities is so much higher than what ordinary people earn in the private sector. This as well is the reason that any practical conclusion to a survey of pay and benefit packages in California’s cities must include an appeal to these unions.

What is coming over the next few years is anybody’s guess, but with the disease epidemic, the social unrest, and the economic destruction that we’ve witnessed so far, there are tough times ahead. It is in these times that public servants, particularly when they wield so much political power, must themselves decide to do the right thing. Lower wages and benefits are not easy for anyone to accept, but to make common cause with the people they serve, and to ensure the solvency of our public institutions, they are necessary.

This article originally appeared on the website California Globe.

 *   *   *


How to Spend Six Trillion Dollars of Magically Materialized Money

If you’re going to spend money you don’t have, you’d better spend it to create things with genuine value. This is the choice facing Americans today. Estimates of how much the federal deficit will grow in response to the pandemic shutdown range as high as six trillion. So how should we spend such a stupendous sum of money?

The last time a huge sum of stimulus money was pumped into the U.S. economy, back in 2009, skeptics were told the money was going to fund “shovel ready” infrastructure projects. President Trump has repeatedly criticized the 2009 stimulus, stating it wasn’t used for infrastructure.

A “Fact Check” written in 2017 by NPR reporter Danielle Kurtzleben made a feeble attempt to debunk Trump’s claim, saying Trump was “mostly wrong” about this. Funny though, the facts cited in Kurtzleben’s own article demonstrate that Trump was “mostly right.” Of the $800 billion stimulus spending, only $81 billion, barely 10 percent, was used for infrastructure.

One may argue that any money going into the economy, for anything, has at least a short-term value, and is necessary in a crisis. That’s obviously true, and this time around, a lot of stimulus money is going to go to be used to provide short term but very necessary relief to households and businesses that would otherwise go under. But what about long-term value?

Usually lost in the debate over just how long the United States can continue to materialize dollars out of thin air is that the answer is affected by what is done with all that money. Specifically, how much of the money is invested in projects that will pay long-term dividends?

How to Mispend Six Trillion Dollars

If you ask the Democratic Socialist schemers, abetted by the Never Trump idiots, traitors and mercenaries (ref. Lincoln Project), 2020 is a chance to fundamentally transform America. The Democratic Socialist agenda is well known, even if the consequences of that agenda are deliberately obscured. And their agenda grabs hold and runs with every crisis, including the current really big one.

Imagine a national “contact tracing” army, backed by ubiquitous drones and an AI enabled data gathering panopticon. Expect to be micromanaged not only in matters of health – whether or not you’ve gotten your vaccines and been chipped – but also just exactly how well you’re minimizing your carbon footprint. Private property and free speech will slowly become a memory. The middle class will go extinct. American citizenship will be meaningless.

And all that money? It will pay for a bigger public sector nomenklatura than ever, along with a comprehensive and very costly assortment of handouts to a population convinced that hard work is for suckers. Some money will be to subsidize “clean” energy, so that renewables combined with severe severe rationing will enable the dismantling of the fossil fuel industry. Eventually, American insolvency will trigger an economic depression from which there will be no recovery.

There is an alternative.

Obstacles to Spending Six Trillion Dollars Wisely

The biggest hindrance to wise spending is not just understanding that tangible projects have to be funded, not just expansion of government and expansion of welfare type programs. The other major hindrance to wise spending is the propensity over the past few decades to spend most of the money meant for infrastructure on planning, mitigation, side projects to appease special interests, litigation, consultants, while absorbing the cost of endless delays.

When examining successful infrastructure projects in America’s past, it’s too easy to attack them from a libertarian perspective, while ignoring their biggest virtue: They got done. They got done with most of the money actually being used for labor and materials. Sure, the Works Progress Administration during the 1930s was a government funded endeavor. But the Grand Coulee Dam, Hoover Dam, along with countless other water reclamation projects, are the reason the American west was turned into a breadbasket for the world, and the reason Americans produced enough electricity to smelt aluminum and build the bombers that won World War Two. Results matter more than ideology.

Similarly, in the 1950s, the interstate highway system was a government funded endeavor. But those roads enabled modern cities and transportation to evolve, catalyzing America’s economic growth at the time, and like those dams, yielding benefits to this day. Even in the 1960s and into the 1970s, big infrastructure got funded and big infrastructure got built. In California, it took only six years for the gigantic San Luis Reservoir, with a capacity of 2.0 million acre feet, to go from concept to being fully operational.

Today, using California as a typical modern example, the proposed Sites Reservoir, of nearly identical design to San Luis, is expected to take 30 years to complete. That’s if they build it at all. We have paralyzed our nation, and the reasons for it aren’t hard to figure out. Everyone has their finger in the pie. Everyone has to get paid off. Special interests have taken over the process of building anything in America, and they will destroy us.

A wonderful, scathing essay recently published on American Greatness by the pseudonymous L0m3z entitled “Bound and Gagged by the Bugmen,” goes a step further. The author identifies “Bug” as the language and jargon adopted by bureaucrats and “experts,” language that offers little in the way of clear meaning and much in the way of obfuscation and obstruction. Towards the end of the essay, the author writes:

“None of this can be done—not the flying cars, or the space travel; there will be no fourth Industrial Revolution—until and unless there is a common language with the capacity to inspire it… Bug language will not allow it. It cannot support its vision. It can only pervert, and inevitably thwart all that dare to be heroic. Bug language cannot be allowed to persist. And we must stomp it out with the heel of our boot.”

The New American Renaissance

The American Left, in its uncritical embrace of the pandemic emergency regardless of the extremes to which it may take us, and in its advocacy for declaring a “climate emergency,” are on to something even if their priorities are terrifying. They want to stomp out opposition to their agenda.

For the American Right to overcome the Left and inspire voters requires more than just exposing the corruption and anti-American essence of the Left. It requires stomping out the parasitic bug culture and bug language that sucks the life out of any endeavor that so much as scratches the earth, be it using public or private funds. And to do those things, a bold agenda must be set that proposes spending money on things we can see; things that will last. Here are examples:

Invest more in strategic military technology and decouple all essential supply chains from China. Approve expansion of mining throughout the United States, whether it’s lithium in California’s Mojave Desert, or uranium on the Colorado Plateau.

Accelerate spending on research and development of fusion energy. Accelerate approval of nuclear power plants throughout the United States, utilizing the latest and safest large scale and smaller modular designs.

Fund NASA and private contractors to establish a permanent base on the water rich South Pole of the Moon before China claims it, and subsidize robotic prospecting and mining of the asteroid belt.

Reform federal laws such as NEPA and override state laws that prevent new housing and manufacturing on open land. Federally fund new highways and connector roads to enable suburban expansion and upgrade and widen existing highways. Accelerate FAA establishment of air lanes for passenger and freight drones.

America today needs the courage that was displayed in the 1930s as we prepared to fight fascism, and in the postwar era as we contained communism. America is now in a new existential conflict, this time with the fascist, racist, expansionist regime that controls the Chinese mainland.

These programs, and others like them, must be done with urgency. Showering money on these types of tangible programs, assuming the bug people don’t siphon off all the money, will guarantee American economic and technological vitality for another century. Transmuting America’s so-called fiat money into modern, robust infrastructure, breakthrough technology, space industrialization, and military supremacy, is feasible alchemy. Let’s get started.

This article originally appeared on the website American Greatness.

Rates of Pay and Pension Debt in California’s Distressed Cities

Nobody needs reminding that California’s cities, like every other going concern in America, are heading for tough economic times. As recently as two months ago, robust collections of sales taxes, utility taxes, transient occupancy taxes, property taxes and other sources of taxes and fees were pouring money into municipal coffers. Now, with the economy abruptly ground to a near standstill, these revenues are all but dried up. But municipal expenses haven’t dropped proportionately, if at all.

What bears reminding is the fact that even before the sudden pandemic shutdown, California’s cities were in financial trouble. Just six months ago – and it seems like a century has passed – the California state auditor released a fiscal health analysis of California’s cities. Measuring factors including cash liquidity, debt burden, financial reserves, revenue trends, and retirement obligations, the report ranked the cities from the healthiest to the most afflicted.

During the economic downturns already endured by California cities in this century, public sector pay and benefits continued to increase even as the private sector workforce experienced layoffs and pay cuts. In the aftermath of the tech bubble bursting, pension benefit enhancements continued to gain approval by cities, one by one, justified by the reasoning that if a neighboring city had done so, then every city must follow suit. In the aftermath of the real estate bubble bursting, city workers took furloughs, where they worked one day less per week and received 20 percent lower pay – but their rate of pay did not decline.

The data presented here, calculated based on data posted on the State Controller’s website, discloses average pay for twenty California cities, all of them within the worst 50 in terms of financial health according to the state auditor. The first chart, below, shows average pay for full time workers. Only five of these cities, Adelanto, Coalinga, Guadalupe, Lindsay, and San Joaquin, show average total compensation under $100,000 per year. By the way, to identify an individual pay record as for a full time worker, the criteria was that the base pay would exceed a minimum of $30,000 and be in excess of the minimum pay reported for that position, and that the individual received health and pension benefits. On that basis, tiny Isleton had zero employees in 2018.

On the chart below there are three cities, Coalinga, Hemet, and Long Beach, which are shaded. The shading indicates these cities DID include the “unfunded contribution” in their total pension benefit expenses per employee. Most cities do not report this cost as part of individual compensation, despite it being a huge expense. This is an important distinction, because the unfunded payments are almost invariably larger than the normal pension payments. That can be seen in the fact that the average individual pension cost for Hemet, $38,650, and for Long Beach, $25,404, greatly exceed the amounts calculated for the other cities. Coalinga, with a relatively small individual pension payment despite including their unfunded payment in the average, is a rare exception. A review of Coalinga’s active employees shows that all of them have post-PEPRA (the 2014 legislative pension reform) benefit formulas, and a review of their Transparent California retiree pensions shows modest retiree benefits. But Coalinga, to put it mildly, is an outlier.

Tough Times Call for Fiscal Restraint

The point of showing this pay and benefits information is not meant to overemphasize how much some city employees make, but rather to provide information that may help convince elected officials and voters that further pay increases should not be considered at this time. The City of Huntington Beach recently approved pay increases for some of their employees, despite knowing the city faces potentially catastrophic shortfalls in revenue in the coming months. There are rumors that the City of San Diego is negotiating possible pay increases. Across the state, cities face the decision to continue issuing cost-of-living increases, step increases, or even negotiating new increases to pay and benefits. But these are not ordinary times. At the least, all forms of compensation should be frozen.

What is often forgotten when discussing issues of public employee compensation is how easy it is to underestimate the accurate averages. Three concepts need to be reiterated.

First, in the public sector, median compensation is almost always higher than average compensation. This is never the case in the private sector, where a handful of very wealthy individuals invariably pull the averages up. Therefore, when we compare median household income to average total public employee compensation, we understate the disparity. (Nerdflash: When Excel comes up with an “=medianifs” function, we’ll prove this!)

Second, many calculations of average income in the public sector include part-time workers, just as many calculations of average pensions in the public sector include retirees who only worked a few years and consequently received a relatively modest pension benefit. The averages presented here are only for full time employees, which is far more representative of how much they make.

Third, total compensation must be considered as the only legitimate measurement of how much anyone makes. While “base pay” may or may not seem low, there is “other pay,” comprised of literally dozens of pay categories including car allowances, meeting stipends, longevity pay, incentive pay, and bonus pay. Similarly, the cost to the employer for pension benefits and health insurance must be counted as pay – doesn’t a self employed person have to set aside money out of their earnings to pay for those benefits?

Here then are snapshots of total compensation for five cities, chosen from among the twenty listed above based on their larger employee headcounts.

The first of these snapshots depict average pay by department for the City of El Cerrito. The first thing that jumps out of the data for this financially troubled city is that their average full time firefighter made an astonishing $246,879 in pay and benefits during 2018. Why do the police, who encounter risks that are arguably equivalent to firefighters, should be averaging total compensation of $175,305, only 71 percent as much, is a mystery. But the solution is not, as is so often the case, to increase police pay. The solution is to reduce firefighter pay.

Something else important to note is that El Cerrito, along with most of the cities considered here, does NOT report as part of its individual employer paid pension benefit, any amounts to pay down their unfunded liability. As previously noted, this grossly understates how much their employees really make.

The estimated median household income in 2017 was $104,455, compared to an average total compensation for El Cerrito’s full time city workers in 2018 of $167,606. Despite entire households (presumably with, on average, more than one worker per household) making only 62 percent of what the average city worker makes in El Cerrito, that’s among the closest ratios you’re likely to see.

Viewing the total compensation by department data for Hemet, below, offers insights into why pension costs are sinking California cities. Remember, this is 2018 data. Back in 2018, pension contributions were calibrated by CalPERS based on actuarial estimates that were only updated through 6/30/2016, because the pension actuaries always submit their formal estimates one year after financial reports are issued. That is, a typical city’s consolidated annual financial report (CAFR) for the fiscal year ended 6/30/2017 would only show pension liability estimates as of 6/30/2016. Yeah. They’re that far behind.

In any case, look at the average employer pension cost for Hemet’s police, $50,632, when base pay for police only averages $78,354. For their firefighters, the average employer pension contribution is even more, $55,431, when base pay averages $81,947. These cities were on track, before the pandemic shut down the economy, to be paying nearly as much in pension fund contributions as they were for base pay.

The median household income in Hemet in 2017 was 39,801; the average full time worker in 2018 made total compensation of $145,922. That’s 3.7 times as much.

The next city, Inglewood, offered in 2018 an average overall total compensation package for its full time employees of $142,806, as depicted in the first chart. And as seen below, their lowest paid employees are the two members of their treasury department – likely clerical positions – at $71,856, and then their Section 8 housing department, where the 22 full time members of that department earned on average $78,430 during 2018. Inglewood had an estimated median household income in 2017 of $51,456.

Let that sink in. The average total compensation of a full time employee with the City of Inglewood is 2.8 times higher than the median household income for a private sector resident of that city. Yes, household income calculations don’t necessarily include the value of benefits. But private sector benefits rarely exceed 25 percent of pay, and “households” on average have more than one employed inhabitant.

Continuing our random gallop through some of California’s financially distressed cities, the next chart shows the City of San Gabriel. The most remarkable thing about this data is that it is unremarkable. If the averages seem excessive, that’s typical. Overall, in fact, San Gabriel’s averages are a bit lower than what is found in most California cities. As usual, their firefighters are making far more than their police – why is this, when it is far harder to recruit police than to recruit firefighters?

And just to be clear: Pointing out this paradox is not to criticize firefighters. More generally, pointing out that public safety employees make a lot of money, and collect pensions we can’t afford, is not to criticize public safety employees. It is merely to make the difficult assertion, with respect, that the reason public safety employees make a lot of money is because sometimes they are on the front lines of bad things, like pandemics.

Freezing rates of public safety pay during a pandemic that paralyzes the economy, along with everyone else’s pay, is the appropriate thing to do. Their pay has always been higher because of the dangerous realities of their job. When the dangerous reality hits, you don’t raise their pay still more, because it has already been raised in anticipation.

The estimated median household income in 2017 for San Gabriel was $59,598. The average pay for a full time city worker in San Gabriel in 2018 was $131,361 (not including cost of unfunded pensions).

Which brings us to Long Beach. Why Long Beach? Sure, they’re among the top fifty distressed cities according to the state auditor’s report, but they didn’t make the top twenty. They’re not among the worst of the worst. Long Beach is a good example of a city that’s done a lot of things right, yet still finds itself estimated to be one of the most financially challenged cities in California. Why?

To really answer that, it is necessary to review not just the average pay for full time employees for the City of Long Beach, which was $143,972 in 2018, compared to an estimated median household income in 2017 of $60,557 – less than half as much. That’s a crippling payroll burden, just like it is in every other city in California. Why do members of the lowest paying department in the city earn, at $89,480 per year, 47 percent more than the average household in the city they serve? Why does the average full time firefighter in Long Beach earn nearly four times as much?

These are difficult questions. But if we can’t ask them now, when millions of Californians are unable to work at all, when can we ask them? What does public service mean in a democracy, if there isn’t shared sacrifice by the government employees, to help carry some of the burden and share some of the fate of the citizens being served?

It’s the Pensions, Stupid

Poor James Carville. His famous quote has made it all the way to the pension overhang, this abstruse albatross, a nerd’s nemesis, ominous but opaque, the theoretical tsunami, the perennial phantom that never materializes, the metaphorical can kicked down the endless road for countless years. But it is. It is the pensions. And we are stupid to ignore them this time.

It was stupid to keep enhancing pensions back in 2001 through 2005 when the economy was digging out from the tech bubble crash and even idiots had belatedly realized that the stock market couldn’t consistently log returns like it had in the late 1990s. A few years after that, it was stupid for cities like Stockton and Vallejo to declare bankruptcy but leave the pension benefit formulas untouched. And it will be stupid, unforgivably stupid, to not recognize that this time, if defined benefits are to be saved, pension benefit formulas for all employees, for future work, need to descend to PEPRA levels.

The final chart here depicts the cash flow impact of changing pension fund earnings projections. There’s actually a lot to like here, so pay close attention. This is a good case, not a typical case. Note that the pension fund, upon most recent 6/30/2018 data (the 6/30/2019 CAFR) for the City of Long Beach was 78 percent funded. That’s a terrible ratio for any pension fund at the end of an eleven year bull market, but it’s nearly 10 percent better than the funded ratio at that time for CalPERS at large.

Observe the total estimated employer contribution in 2019-20, $137.3 million, compared to where it will go in five years – up to $188 million. That’s a 50 million bump they face, and these numbers came out before the pandemic slowdown. And Long Beach is a good case. Check these actuarial estimates for other California cities. In nearly every case, they’re worse. Much worse.

Over the coming months the California Policy Center will produce ongoing analysis of agencies – cities, counties, special districts – that are going to be severely stressed by the ongoing collapse of revenues, combined with the relentless rise in pension costs. But through all of what is to come, two responsible options present themselves. At the least, freeze all pay and benefits. And if possible, move all employees, regardless of hire date, to PEPRA level pension benefits for all future work, effective immediately.

If these two steps are taken, whatever financial challenges these cities face, and there will be many, will nonetheless be significantly easier to bear.

This article originally appeared on the website California Globe.

 *   *   *

How the Homeless Industrial Complex Plans to Destroy Venice Beach

“I intend on putting in another proposal in the next week or two that asks the city to look at the federal bailout or stimulus funds we’ll be getting as a result of this crisis…and using some of that to either buy hotels that go belly up or to buy the distressed properties that are absolutely going to be on the market at cheaper prices after this crisis is over. And use that as homeless and affordable housing. It’s going to be a hell of a lot cheaper to purchase stuff that is already there and move people in there than if we start from scratch. A lot of good stuff is being done.”
– Mike Bonin, LA City Councilmember, 11th District, remarks at 4/18 virtual town hall

It isn’t often you’ll find a politician revealing so explicitly what they’re intending to do, especially when it involves the displacement of an entire well-established community. Nor is it often, if ever, that something so tragic and disruptive as a disease pandemic comes along to hasten the accomplishment of such a nefarious objective.

The policies being enacted in California, and in Los Angeles in particular, to help the “unhoused” find shelter, have little to do with helping the “unhoused.” If they did, the problem would have been solved years ago. Venice Beach provides an excellent case study in how everything being done to help the “unhoused” has a hidden agenda.

The key to understanding this hidden agenda is to recognize that a Homeless Industrial Complex has arisen in California that acquires power and profit by pursuing an utterly dysfunctional strategy. In Los Angeles, for example, instead of rounding up homeless people, sorting them according to their various challenges – drug addiction, alcoholism, criminality, mental illness, laziness, or just bad luck – and moving them into supervised camps in low cost areas of Los Angeles County, the Homeless Industrial Complex has grown into a voracious leviathan, devouring billions in taxpayers’ money. And for all practical purposes, and with all that money, they have just made the problem worse.

This is because you can’t ensure the rule of law when you permit people to wander the streets stoned out of their minds, or sprawled across park benches in a heroin stupor, or drinking and carousing all night long, urinating and defecating everywhere, and then permit them to receive free food and bedding in a shelter two blocks from the beach with no curfew and no restrictions on behavior. But that’s what they did in Venice Beach.

Furthermore, you can’t get the tens of thousands of homeless living in Los Angeles into shelters of any kind, when you’re spending over $8 million to build a shelter with 154 beds, but that’s what they did in Venice Beach. And you can’t move these homeless from that temporary shelter into “permanent supportive housing” in a new structure containing 140 apartments at an estimated total project cost of over $200 million. But that’s what’s planned for Venice Beach.

The members of the Homeless Industrial Complex know this. But they don’t care, because public bureaucracies get funding to expand, and “nonprofit” corporations and their for-profit subcontractors get public funding and tax incentives. These perks are far more lucrative when the “solutions” they construct are on high value land, even though locating supportive housing and shelters in inexpensive areas would solve the problem.

The Next Step – The Destruction of a City

Which brings us back to Councilmember Bonin’s revealing comment: The City of Los Angeles intends to use bailout funds to buy distressed properties and use them to house the unhoused. There are all kinds of problems with this. Here’s what’s happened, and what’s coming next:

The homeless could have been kept off the streets. But the public authorities and their allies in the Homeless Industrial Complex hid behind insufficiently challenged court rulings and legislation that made it prohibitively expensive to house all the homeless, and almost impossible to treat them or hold them accountable.

The current pandemic has crushed the economy, and has been equally devastating to both small landlords and renters. But how have elected officials responded? They have clamped down on landlords, making it impossible to evict tenants, or raise rent, and are even considering mandating a 25 percent rent reduction. While there is some moral justification for these measures during these extraordinary times, what sort of reciprocal relief has been offered landlords? Nothing. No property tax relief, much less grants or low interest loans. “Distressed properties.” Indeed.

For years developers have been eyeing the residential paradise that remains intact on the blocks immediately behind the Venice Beach boardwalk. Armed with phony legislative mandates to protect “sprawl,” and “greenhouse gas,” which has prevented construction of entire new cities along California’s 101, I-5 and 99 transportation corridors, developers hope to demolish these beachfront neighborhoods and fill them with multi-story, multi-family units.

As an aside, but essential to any discussion of the homeless crisis, California’s environmentalist inspired legislative mandates are the reason that developers can no longer make a profit building affordable homes without subsidies. These laws caused California’s housing shortage and were a major factor in causing California’s homeless crisis. They should be revised or repealed.

While there is room for legitimate debate over how cities should manage densification, some of which would still be inevitable and mostly beneficial even if Californians did not live under the oppression of urban containment, what is happening in Venice Beach is not legitimate. It is economic war.

The elected officials in Los Angeles have allowed the homeless population in Venice Beach to become dangerously out of control. Trespassing, theft, disturbing the peace, vandalism, public intoxication and worse are all crimes that are now ignored. The people living in Venice Beach, working hard to pay rent or mortgages, were besieged before this pandemic began. Now, in a cruel twist of injustice, they are under “lockdown,” as the still unrestricted and unaccountable homeless become further entrenched.

Purchasing “distressed” properties will never house all of the “unhoused,” because Venice Beach’s natural attributes of perfect weather, endless beach, and big sky sunsets over the Pacific cannot be altogether destroyed no matter how much the neighborhoods are blighted. In a place like Venice Beach, if you buy houses and give them away, more “unhoused” will come. To squeeze the property owners in Venice Beach while displaying compassion without conditions to the homeless is a travesty. But blight can be useful.

Once Venice Beach acquires a critical mass of blighted and distressed properties, and manage to “house” a sufficient number of the formerly “unhoused,” two things will happen. The blight will empower the city to declare entire square blocks as subject to eminent domain, and the lowered average income per census tract will qualify developers for low income tax credits. At that point, bring on the bulldozers, and say goodbye to a city, a way of life, and whatever incentives may have remained for hard working property owners to work hard and own property.

Councilmember Bonin and his comrades must feel very proud to have seized this moment.

This article originally appeared on the website California Globe.

 *   *   *

Huntington Beach Denies Pandemic Reality, Dispenses Pay Raises

On April 6 the Huntington Beach City Council agreed to pay raises for police officers and city employees. The cost for these raises over the next three years is estimated at $5 million.

In a city that reported general revenues of $188 million in the fiscal year ended June 2019, this raise can accurately be described as small potatoes. Furthermore, in that year the city reported total revenues exceeding total expenses by $25 million. So what’s the big deal?

There are two big problems with this decision by the Huntington Beach City Council. First, and glaringly obvious, is the fact that the revenue incoming to the city has imploded, and there is no end in sight. As Mayor Pro Tem Jill Hardy – a Democrat – said in the council meeting, “how do we ensure we are still a functioning city later if we pay more now.” Hardy went on to remind her peers on the council of past “deals we wished we could take back when the economy got bad.”

This problem, maintaining or even increasing pay and benefits in spite of a bad economy, is a well established pattern in California’s union controlled cities. Just twenty years ago, in the aftermath of the internet bubble popping, city after city went ahead anyway and implemented pension benefit enhancements. Following the precedent set by SB 400 in 1999 – when the internet bubble was still fully inflated – city after city yielded to pressure from CalPERS and their public employee unions to ensure they too would get bigger and better pension benefits.

They did this despite an economy still reeling from the collapse of tech stocks. They did this heedless of an untenable spread between the cost of money – borrowing rates near zero – and the supposed return on investment promised by the pension funds, over 7 percent. That problem, of course, is worse than ever.

Then in 2009, as the U.S. economy slid even closer to the edge of the abyss, with government tax revenues cratering, California’s public employees took “furloughs,” whereby they took one day a week off without pay. The key fact of this supposed sacrifice was that their rate of pay did not drop one iota. They worked less, and got paid proportionally less. They did this while in the private sector whoever wasn’t completely out of a job was accepting a lower rate of pay with gratitude, because at least they still had a job. They were working as hard as ever.

This is the context of what just happened in Huntington Beach, and if it is the harbinger of similar actions in the rest of California’s cities, then we’ve learned nothing from recent experience.

The litany of what California’s cities are in for this time is already well scripted and already overplayed for anyone paying attention, but for Huntington Beach in particular, here’s a snapshot:

In FYE 6/30/2019 the city collected $89.1 million in property taxes, $47.4 million in sales taxes, $18.8 million in utility taxes, and $14.0 million in transient occupancy taxes. How far are those collections about to fall?

By the end of this fiscal year, Huntington Beach will have endured nearly five months of a catastrophic slowdown. With most retail businesses closed, expect sales tax receipts down by around $10 million. With nearly all types of businesses closed, expect utility taxes to also fall, probably by another few million. With the hotels closed up almost entirely, expect transient occupancy taxes to also be down by a few million. Figure the city’s revenues will drop by $15 million in the current fiscal year, maybe more.

But next year could be worse. Huntington Beach is a tourist mecca, with surfing competitions, art shows, air shows, volleyball tournaments, and the longest pier on the west coast. Literally millions of tourists visit Huntington Beach every year. Will they fill the hotels and beaches in the summer of 2020? Will all of these planned events take place? And what about property values? What is going to happen if property values fall, imperiling Huntington Beach’s largest source of revenue?

In their annual report, Huntington Beach touts their financial resiliency in the face of “industry specific downturns.” But they are not protected against general economic downturns, and their tourism industry, along with their stratospheric property valuations, render them more vulnerable in a severe recession, not less.

While Revenues are Going Down, Expenses are Going Up

Maybe the raise awarded Huntington Beach’s city employees was not a big portion of their total annual expenses, less than one percent. But Huntington Beach is liable to be looking to cut expenses wherever they can in the coming years, because their required payments to CalPERS are heading way up. This problem, dramatically escalating annual pension contributions, is not a trivial budget item, it’s hitting every city in California, and it was set to wreak financial havoc even before this pandemic triggered downturn made everything much worse.

Referencing the public agency actuarial reports provided by CalPERS for Huntington Beach’s miscellaneous and safety employees, and as confirmed by the authors of Huntington Beach’s otherwise glowing financial report for FYE 6/30/2019, pension payments are going to eat that city up. Quoting from the annual report:

“CalPERS has instituted aggressive funding schedules in order to reach 100% funded status within the next 20-30 years, resulting in dramatic increases to the City’s UAL payments from $4.58 million in FY 2008/09, $24.93 million in FY 2018/19, up to a staggering $46.02 million in FY 2029/30.”

Not mentioned in the annual report, but available on the actuarial tables are the immediate hikes in CalPERS payments. They will rise by $5.0 million year over year to 29.9 million in 2019-20, and then in an ongoing series of sharp steps upwards will hit $40 million by 2023-24. The strategy being pursued by Huntington Beach, at least according to their annual financial report, is to attack their nearly half-billion dollar unfunded pension liability another way, through pension obligation bonds.

This is an interesting strategy these days, because low interest rates have filtered all the way down to the POB market, and money can be borrowed on 20 year terms for just 3.0 percent. As of 6/30/2019 Huntington Beach’s officially recognized unfunded pension liability was $436 million, which represented a 67 percent funded system. It’s certainly worse by now, so assume they borrow $500 million to get themselves fully, or nearly fully funded. This would result in payments of $33 million per year. That is considerably less than the projected UAL payments.

The only thing irrational about borrowing at low interest rates to fully fund employee pensions might be, sadly, that if this rescues the city’s cash flow, the unions come back and demand even more money.

Which brings us to the second problem with granting a raise to city employees in Huntington Beach; they already do very well for themselves.

How Much Do Huntington Beach Employees Make?

For a visceral answer to this question, look no further than Transparent California’s salary report for Huntington Beach, where 107 employees were reported to have total pay and benefits in excess of $300,000 during 2018, and an incredible 331 employees had total pay and benefits in excess of $200,000. To put this in perspective, during 2018, there were only 766 employees who completed the full year as full-time employees with full benefits.

It’s fair to question the Transparent California data, however, because the analysts include a column called “Pension debt,” where a substantial amount appears. This is where they have allocated, on a pro-rata basis, the unfunded liability payment which agencies stopped doing back in 2017 – ostensibly to make reporting more accurate. The effect of this omission by California’s reporting agencies was to make it look like these employees made less in total compensation. But shouldn’t the cost to pay down the unfunded liability be considered part of an employee’s compensation?

Answering that question completely is a subjective exercise in futility, and only the most hardened nerds would find the discussion even remotely interesting. So instead, here is a table that uses State Controller data, downloaded from the state controller’s website, to report the total compensation of Huntington Beach employees – without including the payment on the unfunded liability:

If you’re trying to decide if these levels of compensation are enough or too much, there’s a lot to juggle. One immediate and rather inexplicable observation, common to most cities, is that firefighters are making more than police. Why is this, when there are perennial challenges to recruit police, whereas firefighting positions invariably attract hundreds if not thousands of applicants every time there is an open position?

Another puzzling fact that falls out of this pay schedule is the apparent affordability of pensions. This is grossly deceptive. “Normal” costs for pensions, as displayed on this table, average no more than the cost for health benefits. These misleading numbers underscore the deplorable state of pension fund management over the past 20 years, because most of the money being sent to CalPERS by Huntington Beach, and every other participating agency, is to pay down the unfunded liability. And the reason the unfunded liability is so huge is because the “normal” contribution has never been adequate. It certainly isn’t adequate now, but it obviously never was.

Political Pressure to Understate the “Normal” Cost for Pensions

Explaining this requires a careful balancing of nerd arcana with justifiable outrage. Enough arcana to make explicit what’s happened, enough outrage to make explicit just how much it matters.

Here goes: The “normal” contribution is how much money has to be invested per year in order to pay – after earning interest for years – for that additional bit of retirement pay that was earned in that year. For those who are still reading, here’s the kicker: The higher the percentage CalPERS predicts it can earn on its investments each year, the lower the “normal” contribution. Unfortunately, this rate-of-return projection is under extreme political pressure to remain higher than what history has demonstrated to be realistic. Recent events cruelly emphasize that historical lesson.

But if the rate-of-return is high and the normal contribution is low, then employees don’t have to contribute as much to their pension plans via withholding. And participating agencies, such as Huntington Beach, don’t have to pay as much into the pension funds. By falsely making them appear to be more affordable than they really are, it makes it politically easier to maintain, or even increase, pension benefits.

At this point, the story goes further downhill. As the normal contributions fell short, year after year, cities and other agencies participating in the CalPERS system played fast and loose with their repayment plans on the growing unfunded liability. Like the negative amortization mortgages that came due with a bang back in 2009 and 2010, eventually that house of cards collapses. Hence, a few years ago, CalPERS finally cracked the whip, requiring cities to pay down their unfunded liability on 20 year terms with level payments.

Readers who have a life may be forgiven for skimming the last three paragraphs, and may be commended if they are still reading at all. Here’s the bottom line: According to data straight from CalPERS, Huntington Beach taxpayers in 2019-20 will pay $14.7 million for the “normal cost” of their employee pension benefits. They will pay $29.9 million in catch-up money, aimed at paying down the unfunded liability for their pensions, twice as much as the normal cost.

When calculating an employee’s total compensation, clearly the cost of catch-up payments to bring a pension system back from 65 percent funded to fully funded belongs somewhere. To argue otherwise invites the suggestion that unfunded payments cease, and instead pension benefits become resized downwards, dramatically downwards, since that rather draconian measure would also serve to restore fully funded status to the system.

The rejoinder to this argument (hardened nerds, pay attention here) is that already retired workers also depend on the paydown of the unfunded liability, and the cost to sustain their pensions should not be included in any allocation of unfunded costs to active employees. With that in mind, even just allocating half of 2018-19’s $24.9 million unfunded pension contribution to the total compensation of active Huntington Beach’s employees yields a significant increase as follows:

On a pro-rata basis, this calculation increases the citywide average (using just half the unfunded payment) cost from $14,851 per full time employee to $28,532. Pension costs per police move from an average of $18,078 to $35,584, for firefighters from $23,367 to $45,995. In terms of total compensation, on this basis, the citywide average rises from $151,500 to $165,181; the police average rises from $164,457 to $183,074; the firefighter average rises from $204,064 to $227,065.

Huntington Beach’s Action Must Not Set a Precedent

It was hard to listen to the Huntington Beach city council members as they explained their reasoning prior to their voting, and not wonder what influences worked on them beyond the implacable reality of an insatiable pension system and a global economy that’s hit the pause button. To be sure, there had been prior discussions and agreements made, and one may argue this vote was a mere formality, ratifying compromises that were already well settled. But that’s a rather thin argument. When the Titanic hit an iceberg, did the Captain change his evening schedule?

The biggest problem with what Huntington Beach councilmembers did is the precedent it sets. The city faces a financial calamity, and avoiding $5.0 million more in expenses over the next three years will not change much. But what is needed now, in every city in California, is a freeze on compensation, among other things. It is virtuous and necessary to hope the economic meltdown that’s happening before our eyes will be overcome, and an economic recovery will soon take hold and sweep away our financial anxieties. But until that time comes, local elected officials have to stand firm. Unless things change, tough times are ahead.

Even harder are what must be asked of the public sector union leadership and members at a time like this. The reason public safety employees make more than they ever did historically is because as a society we value life more than we ever have in history. When we hire people to risk their own lives to protect us, we pay them very well because their lives, and our lives, matter more. That’s fine. But this pandemic is the reason we pay public safety employees so much money already. It is not the reason to pay them more, even though it certainly is the reason we appreciate them more than ever.

This article originally appeared on the website California Globe.

 *   *   *

Post-Coronapocalypse Pension Reform Checklist for California

In a perfect world, California’s state and local public employees would receive exactly the same retirement benefits as federal employees. They would receive a modest defined benefit, a contributory 401K, and they would participate in Social Security.

Unfortunately, in California, while some state and local public employees are offered 401Ks, and many participate in Social Security, all of them rely inordinately on a defined benefit pension. Far from being modest, even the most minimal examples of defined benefit plans for California’s state and local government workers provide roughly twice the value of the typical defined benefit offered federal workers. And where there’s twice the value, there’s twice the cost.

In reality, however, twice the cost would be a bargain. It’s much worse than that, and very little has been done. In 2013, the PEPRA (Public Employee Pension Reform Act) legislation lowered pension benefit formulas in an attempt to restore financial sustainability to California’s public employee pensions. But these revisions, which resulted in defined benefit formulas only about twice as generous as the federal formulas, only applied to new employees.

California’s Pension Systems Were Crashing Before the Coronapocalypse

Two years ago, and after more than eight years of a bull market in the stock market indexes, CalPERS, which is by far the largest pension system in California, had already announced that contributions from participating agencies were going to roughly double. They posted “Public Agency Actuarial Valuation Reports” that disclosed the details per agency.

At the time, in partnership with researchers at the Reason Foundation, the California Policy Center used these reports from CalPERS to summarize the impact on 427 cities and 36 counties (download full spreadsheet). As shown on the table below, two sets of numbers are presented – payments to CalPERS for the 2017-2018 fiscal year, and officially estimated payments to CalPERS in the 2024-25 fiscal year.

The most important distinction one should make when reviewing the above data is the difference between the “normal” and the “catch-up” payments. The so-called “normal contribution” is the amount the employer has to contribute each year to maintain an already fully funded pension system. The “catch-up” or “unfunded contribution” is the additional amount necessary to pay down the unfunded liability of an underfunded pension system.

As can be seen in the example of Millbrae (top row, right), by 2024, the “catch-up” contribution will be nearly six times the amount of the normal contribution. But in the PEPRA reforms, new employees are only required to contribute via payroll withholding to 50 percent of the “normal” contribution.

A separate California Policy Center analysis, also published two years ago, attempted to estimate how much total payments statewide would increase if all of the major pension systems serving California’s state and local public employees were to require similar levels of payment increases. The analysis extrapolated from the consolidated CalPERS projections for their participating cities and counties and estimated that in sum, California’s state and local government employers would have paid $31 billion into the 87 various pension systems in 2018, and by 2024 this payment would rise to $59.1 billion.

As noted at the time, and now more than ever, this was a best case scenario.

A Financial Snapshot of CalPERS Today

The next chart, below, depicts financial highlights for CalPERS – either officially reported or projected – in a format which ought to be publicly disclosed, every quarter, in this format, from every state and local public pension system in California. The first two columns depict data as reported by CalPERS for their most recent two fiscal years, ended 6/30/2018 and 6/30/2019. The final column, which consists of CPC estimates (not provided by CalPERS), shows how their financial condition could appear three months from now.The first thing to note from the above chart is the fact that CalPERS was only 70 percent funded (“funded ratio,” bottom line) in June of 2019. The next thing to note, and this is crucial, is that the actuarial estimates of the total pension liability lags behind one year. That is, the $504.9 billion reported “actuarial accrued liability” is reported as of 6/30/2018, even though that figure is used to report the funded ratio as of 6/30/2019.

Take a deep breath, because the significance of this delay requires further discussion. From page 122 of CalPERS most recent CAFR, here are the trends for the actuarial accrued liability: 6/30/2009 = $294B, 2010 = $308B, 2011 = $328B, 2012 = $340B, 2013 = $375B, 2014 = $394B, 2015 = 413B, 2016 = 436B, 2017 = $465B, and 6/30/2018 = $504B. Based purely on the trend, is there any reason to believe this liability will not exceed $550 billion by June 30, 2020, two years later? Why isn’t that estimate being made?

There’s more. Why are actuaries permitted to have an entire extra year to complete their estimate of the total pension system liability, when changing single variables will cause the estimate to massively fluctuate? Sure, it is a complex exercise, and at some point an official calculation, based on all known data, should be reported that amends a preliminary estimate. But if, for example, you vary the earnings projection downwards from 7.0 percent to 6.0 percent – which needs to be done sooner not later – using calculations provided by Moody’s Investor Services, the amount of the CalPERS liability soars from $550 billion to $621 billion. You don’t split hairs when you’re being scalped.

And what about the employer contribution (second row of data)? Why did it go down from $20 billion in 2018 to $15 billion in 2019? From the “Basic Financial Statements” in the CalPERS CAFRs for the last few years, here are the totals for payments by employers: 2015 = $10.2B, 2016 (page 38-39) = $11.0B, 2017 = $12.4B, 2018 (page 40-41) = $20.0B. With the payment for FYE 6/30/2019 back down to $15.7B, the trends suggest that the large payment of $20.0 billion in 2018 was an anomaly. But assume that much money will come again from employers in 2020. But based on historical trends, probably not more than that. Yet.

Where does this put CalPERS?

All of this discussion is to explain the reasoning behind the figures in column three on the above chart. What might be materially different? What estimate isn’t best case? Does anyone believe CalPERS will actually break even in the return on their invested assets between 6/30/2019 and 6/30/2020? Does anyone believe the most accurate estimate of the total liability belongs anywhere south of $550 billion, particularly when they’re still using a discount rate that’s too high? And yet this puts CalPERS in what is arguably the worst shape it’s ever been, at 64 percent funded as of this June.

This paints a very grim big picture. CalPERS is on track to collect over $20 billion from taxpayers in the current fiscal year, and CalPERS, while the biggest pension system, only manages just over 40 percent of the state and local government pension assets in California. This suggests that the total taxpayer contribution to California’s state and local government pension systems in 2020 is already up to around $50 billion. And it isn’t nearly enough.

Steps to Reform CalPERS and all of California’s pension systems

1 – Admit the long-term rate of return projection is too high for calculating the value of pension liabilities. Move it down to 6 percent. Increase the required “normal contribution” accordingly, and, in turn, increase the share required from active employees via withholding.

2 – Once a more reasonable long term rate of return projection is adopted by the pensions systems, the goal of pension reform should be to stabilize pension system payments at some maximum percent of total personnel costs. With cooperation from union leadership, agree on what that maximum percent should be, then determine how to spread benefit reductions in an equitable manner between new hires, current employees, and retirees.

3 – For all state and local government employee pension plans in California, start providing consolidated quarterly financial summaries (without gimmicks), using the above chart as an example. Include a footnote indicating how much of the total employer contribution is for the unfunded liability vs the normal contribution.

4 – If a pension system falls below 80 percent funded, agree on an escalating series of remedies to be implemented to bring the funded ratio back up. They would include suspension of COLA, prospective further lowering of the annual multiplier for active workers, retroactive lowering of the annual multiplier for active workers, reduction of the retiree pension payment, and increasing the required payment to the pension plan by active workers via withholding.

5 – Pressure the California State Supreme Court to swiftly hear and rule on the cases Alameda County Deputy Sheriff’s Ass’n. v. Alameda County Employees Retirement Ass’n (filed 1/8/2018), and Marin Ass’n of Pub. Employees v. Marin Cnty. Employees Retirement Ass’n (filed 8/17/2016). These cases may provide clarity on the “California Rule,” which currently is interpreted as prohibiting lower pension benefit accruals, even for future work.

6 – With or without a decisive ruling (or any ruling) on the California Rule, work with government union leadership to revise pension benefits. If union leadership is uncooperative and the courts fail to offer an enabling ruling, than as a last resort, to bring the unions back to the negotiating table, lower salaries, current benefits, and OPEB benefits.

7 – In the long run, move towards a system modeled after the federal system. This would be a logical next step, following in the footsteps of PEPRA. It would create three basic tiers of public sector workers in California, the pre-PEPRA workers (who may submit to lower benefit accruals for future work), the post-2013 hires who are subject to the PEPRA reforms, and new hires starting in, for example, 2021, who would enjoy retirement benefits similar to what Federal employees receive.

The Ripple Effect of Unreformed Pensions

There are two problems with a bullish outlook today. First of all, the great returns of the past few years may have been unsustainable, a super bubble. And then that super bubble was not popped by a pin, but rather by a wreaking ball, the Coronapocalypse. There are tough economic times ahead.

In a severe downturn it is conceivable that annual taxpayer contributions to California’s public employee pensions systems will not merely soar from around $50 billion in 2020 to $60 or $70 billion within a few years. They could go even higher. For example, over the total three year period through June 2020, it is quite possible that CalPERS will collect more from taxpayers – $65 billion – than it will have earned in investment returns – $52 billion.

This is the new reality of public sector pensions in California. And because taxpayers have been increasingly on the hook to bailout these pensions, taxes have increased, services have been cut, and there has been a gradual wearing away of trust by citizens in their local governments. This is why, for the first time in decades, more local taxes and bonds were rejected by voters in March 2020 than were approved. Absent pension reform, this backlash has just begun.

So-called “crowding out” of other public services in order to pay for pensions doesn’t just impel an insatiable drive for higher taxes. It also works its way into higher fees, building fees in particular. Infrastructure investments such as connector roads and parks for new housing subdivisions used to come largely out of municipal operating budgets. It was a fair trade – the city builds the roads, the builders sell the homes, and the new residents pay taxes. But now, all of those costs are paid for by the builders and passed on to the home buyers. The rising cost of pensions can be directly tied to the unaffordable cost of homes.

Pensions for state and local government employees in California are literally three to five times as costly as Social Security, and at least twice as costly as the Federal Retirement System. Ultimately, this disparity divides Americans and undermines what it means to be an American citizen. Why should public employees care if Social Security is inadequate, if they don’t depend on it? Why should they care if all public benefits offered private taxpayers is diluted, or if citizenship itself becomes less meaningful, if their membership within the public sector is the primary source of their security?

America is entering difficult economic times. Maybe one good thing to come out of this will be a willingness on the part of public sector union leadership to make common cause with all of California’s workers, and agree to reasonable concessions on pensions that will help everyone living in this great state.

This article originally appeared on the website California Globe.

 *   *   *

Plastic Bags and the Recycling and Reuse Scam

Back in 2014, the California Legislature passed Senate Bill 207, which banned grocery stores from offering customers “single use” carryout bags. Permanent implementation was delayed by a November 2016 voter referendum, Prop. 67, that unsuccessfully attempted to repeal the measure. Today it is well established law.

The only way SB 207 was sold to the grocery industry was through an incentive that permitted them to keep the ten cents per “reusable” bag that they would be required to charge customers.

California’s pioneering ban is touted by environmentalists as an example for the nation, and progressive cities and states have enacted similar laws. But in reality, it is misguided policy that does more harm than good.

Today, instead reusing the free single-use bags to line their trash cans and dispose of their cat litter, Californians now pay ten cents every time they exercise that privilege. And how does this help the environment, when reusable plastic bags have 11 to 14 times the mass of disposable plastic bags, and hardly anyone reuses them that many times?

Further evidence of the absurdity of laws banning single-use plastic bags is found in a study commissioned by the United Kingdom’s Environmental Agency, which estimated reusable grocery bags made of cotton fabric to have 131 times greater “global warming potential” than conventional disposable plastic bags.

And now consumers have less reason than ever to reuse their reusable bags, because they’re germ carriers.

This isn’t new information. Common sense would dictate that when consumers purchase grocery items, and allow them to knock around inside a plastic bag, pathogens will be transferred from the surfaces of the grocery items onto the surface of the bag.

Similarly, when consumers set those bags down, such as on the seat or floor of a bus or subway car, or in a shopping cart that someone else is about to use, any pathogens on that surface or on that bag will transfer back and forth – presumably over and over. And even among those who reuse these bags more than 11 times, or 14 times, or 131 times, how many people disinfect them, every single time?

A recent article entitled “Greening Our Way to Infection” appearing in City Journal, provides an excellent summary of the disease risks attendant to reusable grocery bags. Author John Tierney exposes the absurd denial of public health authorities, both before and since the Covid-19 outbreak, to the risks of using reusable grocery bags. He writes:

“A headline on the website of the New York Department of Health calls reusable grocery bags a “Smart Choice”—bizarre advice, considering all the elaborate cautions underneath that headline. The department advises grocery shoppers to segregate different foods in different bags; to package meat and fish and poultry in small disposable plastic bags inside their tote bags; to wash and dry their tote bags carefully; to store the tote bags in a cool, dry place; and never to reuse the grocery tote bags for anything but food.”

This is the world the green extremists want us to live in. Not only shall we reuse our reusable plastic bags more than eleven times, just to break even on the “carbon footprint” vs. a disposable plastic bag, but we shall “segregate different foods in different bags; to package meat and fish and poultry in small disposable plastic bags inside the tote bags; to wash and dry tote bags carefully; to store tote bags in a cool, dry place; and never to reuse tote bags for anything but food.” And cat litter.

The Irrational Extremes of Recycling and Reuse

While recycling is both profitable and green in certain cases such as with newsprint and aluminum, for most garbage it is neither. Plastics, bags and all, are a compelling example of this. For starters, there is no factual basis for the argument that plastic must be recycled because we may eventually run out of petroleum. This is easily documented.

According to the energy news site OilPrice.com, in 2012 “plastics production accounted for about 4 percent of global oil production.” Four percent. According to the BP Statistical Review of Global Energy, over the past twenty years, proven oil reserves increased faster than consumption. In 2018 there were 1.7 trillion barrels of proven oil reserves worldwide, up from 1.1 trillion barrels in 1998. Plastic, which can also be made out of natural gas or coal, will never run out of the raw materials required for its manufacture.

As for plastics accumulating in the environment, the ocean in particular, much of it comes from fishing nets. One of the largest accumulations of ocean plastic is the Great Pacific Garbage Patch, a collection of concentrations of marine debris in the North Pacific Ocean created by ocean currents. According to Sea Shepherd Global, nearly half of the plastic in these areas come from discarded fishing nets, and “more than 70% of marine animal entanglements involve abandoned plastic fishing nets.”

As for the source of ocean plastic coming from sources on land, a report in USA Today cites a study published in the journal Science that estimates 242 million pounds of plastic waste are discharged by Americans into the oceans each year, and that the total discharge of plastic waste into the oceans, worldwide, is between 8 to 12 million tons. A quick, somewhat innumerate read of those numbers might incline one to believe that America is the prime offender, but that would be wrong. Once pounds are converted into tons, it turns out that plastic waste from America, at most, constitutes only 1.5 percent of the plastic trash currently going into the world’s oceans.

This is where it becomes problematic to focus on recycling and reuse, rather than containment in landfills. Because even in America, it is a costly indulgence to recycle most of the waste stream. To emphasize recycling in developing nations, it is futility. The scarce economic resources of developing nations in Africa and Asia would instead be much better used to develop landfills.

There is No Shortage of Landfill Capacity, and There Never Will Be

One of the earliest serious intellectual revolts against the modern recycling industry came in an in-depth 1996 essay in the New York Times Magazine entitled “Recycling is Garbage.” Authored by the same John Tierney who recently joined City Journal after more than two decades as a reporter and columnist with the New York Times, it exposes how misguided environmentalism and government subsidies corrupted the waste management industry.

In his 1996 essay, Tierney described how environmentalist journalists and activists convinced the nation that if something wasn’t done, and soon, Americans were destined to be “buried alive” under the mountain of trash they were creating. He explained that most materials in garbage are not worth recycling, but that politicians are now afraid to oppose recycling. He explained that modern landfills are now required by federal law to be “lined with clay and plastic, equipped with drainage and gas-collection systems, covered daily with soil and monitored regularly for underground leaks,” but the perception remains that opening new landfills will poison the local populace.

Nearly 25 years later, for most Americans, all of these misconceptions still constitute conventional wisdom. The biggest misconception of all is the claim that there is no room left in America’s landfills. Today more than ever, there are plenty of alarmist reports making that claim.

From Waste Business Journal: “Time is Running Out: The U.S. Landfill Capacity Crisis.” From Global Citizen: “Where Will The Trash Go When All the US Landfills Are Full?” Perhaps the biggest scare story of all appears on the website “How Stuff Works,” where they visualize what America’s roughly 258 million tons of municipal solid waste each year would look like, if it was dumped onto one pile, year after year for 100 years. The estimate takes into account a doubling of the U.S. population over this hypothetical century, apparently assuming the annual waste flow would also double during that period as well.

“If you keep filling up this landfill for 100 years, and if you assume that during this time the populations of the United States doubles, then the landfill will cover about 160,000 acres, or 250 or so square miles, with trash 400 feet deep. Here’s another way to think about it. The Great Pyramid in Egypt is 756 feet by 756 feet at the base and is 481 feet tall, and anyone who has seen it in real life knows that it’s a huge thing — one of the biggest things ever built by man. If you took all the trash that the United States would generate in 100 years and piled it up in the shape of the Great Pyramid, it would be about 32 times bigger. So the base of this trash pyramid would be about 4.5 miles by 4.5 miles, and the pyramid would rise almost 3 miles high.”

That sounds like an awful lot of garbage, and an awful burden on the land and the people. But it isn’t. Compared to the size of the lower 48 states, compared to the size of America’s urban areas, compared to the area of America’s reservoirs, or mines, or the footprint of its freeways; compared to pretty much any other major category of American infrastructure, it is negligible. To counter the scope insensitivity of the average American journalist, here are some calculations:

A “trash pyramid” 4.5 miles by 4.5 miles, rising three miles high, if it were to be poured into America’s roughly 2,000 active landfills, would require each of those landfills to accommodate 100 vertical feet of garbage, over a surface area of 341 acres. Altogether, these 2,000 landfills would consume about 1,066 square miles of land. Notwithstanding the fact that some landfills are designed to accommodate up to 500 vertical feet of trash, or the fact that parks and other amenities are often built on the top of landfills once they reach capacity, 1,066 miles is a trivial amount of land compared to other impacts of human civilization.

For example, America’s lower 48 states occupy 3.1 million square miles. This means that if by 2120, 650 million Americans were still producing the same per-capita quantities of garbage that they produce in today’s throw-away society, those 3,200 square miles of landfills would only occupy one-tenth of one percent of the available land. America’s urban areas consume just over 100,000 square miles; these hypothetical landfills only increase that by 3 percent.

Just America’s ten largest reservoirs occupy 2,670 square miles; the entirety of America’s reservoir inventory would occupy a far larger area. America’s open pit and surface mines occupy thousands of square miles as well, and if America is to innovate its way into the electric age, rare earth mining will increase that footprint. As for America’s 46,000 miles of interstate highways, even at a conservative estimated average width of 300 feet, taking into account all interchanges and not counting all the other national and local roads, these interstates consume 2,600 square miles.

Civilization Requires Tough Choices

The evidence supporting containment in landfills vs recycling is unambiguous. Earlier this month, writing for National Review, Kyle Smith pointed out not only the excessive cost of recycling, but reminded us that it’s a good time for a fundamental reassessment of our waste management policies. He writes, “it costs $300 more to recycle a ton of trash than it would to put it in a landfill. When the next budget crunch hits New York – and that’s due approximately ten seconds after the next stock-market crash – recycling would be an excellent program to cut.”

That budget crunch has arrived. And even if the markets and the economy come roaring back, New York City taxpayers have better ways to spend their money than supporting a parasitic industry that does nothing, absolutely nothing, to help the environment.

But the moral argument doesn’t end there. Americans who support environmentalist policies need to think about the example they’re setting for the rest of the world. The message that needs to go out to developing nations – along with “develop clean fossil fuel and quit poisoning your air with genuinely harmful pollutants” – is build landfills and sequester your solid waste. Americans need to show by example how modern landfills are built, not how to painstakingly “recycle” everything regardless of its utility or affordability.

Eventually, just as eventually American innovators will commercialize fusion power, someday American innovators will commercialize plasma waste converters, turning solid waste into valuable feedstock to generate energy and building materials. When that day comes, not only will waste management no longer leave an expanding footprint, however trivial it may be, but we can mine the landfills if we wish.

Back in 1996, in his essay for the New York Times about recycling, Tierney arrived at the ultimate reason for its persistence as policy despite its negative economic impact and despite being of dubious environmental benefit. He writes:

“The leaders of the recycling movement derive psychic and financial rewards from recycling. Environmental groups raise money and attract new members through their campaigns to outlaw ‘waste’ and prevent landfills from opening. They get financing from public and private sources (including the recycling industry) to research and promote recycling. By turning garbage into a political issue, environmentalists have created jobs for themselves as lawyers, lobbyists, researchers, educators and moral guardians.”

Doesn’t that sound familiar? It’s as true today as it was in 1996, and it applies to so many issues of public policy where environmentalists have formed an alliance with powerful financial special interests. It is wonderful when one may reward their psyche and their pocketbook at the same time, but when delusion and corruption is the prerequisite for such rewards, society loses.

Americans are correct to recognize the perils of reusable grocery “tote bags” during this time of heightened disease risk. May they also realize the entire concept of reusable grocery bags is flawed, along with most recycling programs, and adapt accordingly.

This article originally appeared on the website American Greatness.

 *   *   *

Black Swans and Super Bubbles

Black Swan: an unpredictable event that is beyond what is normally expected of a situation and has potentially severe consequences.”
Investopedia

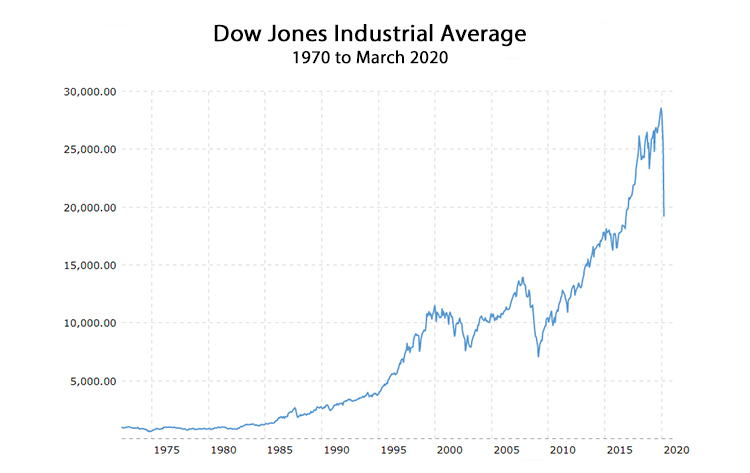
For decades there have been so-called “permabears” claiming that investment returns in the stock market were unsustainable. When the internet bubble popped in 1999, the permabears felt vindicated. But then, starting around 2003, the bulls came back. In 2009, the housing bubble popped and the permabears were vindicated once again. But then the bulls came back with a vengeance, going on an 11-year rampage during which the value of the Dow Jones Industrial Average rose from a low of 6,627 on March 2, 2009 to a dizzying height of 29,398 on February 10.

In 10 years, 11 months, and nine days, the Dow more than quadrupled.

If an investor put their savings into the stock market back in early March, 2009, and sold it in early February 2020, he would have realized an annual return of over 14 percent. The chart below shows the value of the Dow since 1970. It is not a logarithmic scale, so the grade of the slope indicates absolute changes. So why is it that the value of the Dow displayed almost no growth between 1970 and 1985, then embarked on a roller coaster ride heading mostly up?

Whenever delving into the dismal science of economics, it’s important to acknowledge that nobody, regardless of their credentials, has a crystal ball. And when it comes to discussing the big variables, primary causes, and optimal solutions, there is no consensus.

But with stock values correcting yet again, the permabears need to be heard. It isn’t just stock values that are at risk. The bubble this time has been dubbed the “super bubble,” incorporating not only stocks, but bonds and real estate as well. To understand why permabears make this argument, the historical interest rate trends since 1970 are illuminating.

The next chart shows the 10-year U.S. Treasury note rate over the past 50 years. The first thing to notice is the inverse relationship between the T-note rate and the growth trends in the DJIA. As the rate for T-notes fell, the value of the Dow rose. The relationship between index rates and the value of stock equities makes intuitive sense. When fixed-income T-notes and bonds are paying high rates of return, there is less demand for stocks. Also supporting this inverse relationship between interest rates and the value of stocks is the fact that when interest rates are low, more borrowing occurs, which stimulates consumer spending and corporate profits, raising the value of their stock.

Theories aside, whenever the stock market was falling, interest rates were lowered in order to stimulate growth and restore the bull market in stocks, and whenever the stock market was getting overheated (“irrational exuberance”), interest rates were raised which would slow the growth in stock values.

When the internet bubble driven stock market peaked, helping drive the Dow up to 11,723 by January 2000, 10-year T-notes were paying 6.7 percent. But as the stocks fell, so did interest rates. The Dow bottomed out at 7,740 in September 2002, with the trough for the 10-year T-note shortly thereafter in January 2003 at 3.3 percent. Then as stock values rose, Treasury rates rose as well. When the real estate bubble popped in October 2007, the 10 year T-note was back up to 5.2 percent. But the Great Recession decimated the stock market, and threatened to crash the entire economy.

In moves to stimulate the economy during this extraordinary time, the 10-year T-note hit a low of 2.1 percent by December 2008. But then something strange happened. The interest rate of the T-note never fully bounced back. The highest it ever got, during this most recent 11-year bull market in stocks was 3.2 percent in October 2018. And when the DJIA hit its all time high this past February, the 10-year T-note was already down—way down—at 1.5 percent.

This fact, that interest rates were at an all time low when the stock indexes were at all time highs, makes this correction in stock values different from the two most recent previous corrections. It means that interest rates were still being lowered in order to stimulate economic growth even when the stock indexes were increasing. It means that this time, the most easily applied and reliable tool to stimulate economic growth, lowering interest rates, is not an option. It is the reason the permabears have referred to this most recent investment bubble as the “super bubble.”

“Super bubble” refers to the belief that not just stocks are overvalued, but also bonds and real estate. The reason bonds are considered overvalued is related directly to interest rates, as set by the Federal Reserve and the U.S. Treasury. When current debt is issued at a lower fixed rate of interest, then debt that was issued in the past at higher rates increases in value. This is because on the open market for bonds, any bond paying a higher rate will fetch a higher price, until whatever fixed amount the bond pays in interest matches the current interest rate.

For example, a 10-year T-note purchased for $10,000 in October 2018 was paying 3.2 percent, or $320 per year. But once interest rates fell to 1.5 percent in February, the October 2018 T-note only had to pay $150 per year to trade at a competitive rate. Since the rate is fixed, however, the price rises instead. All of a sudden this $10,000 T-note paying $320 per year is theoretically worth $21,000, because 320 divided by 21,000 equals 1.5 percent. While this explanation is a gross oversimplification, the causal relationship between interest rates and bond prices is indisputable. When interest rates fall, there is a rally in bond prices. Bonds, along with stocks, have been great investments over the past few years, but how can they possibly continue to appreciate?

The 10-year Treasury note is currently paying 0.5 percent interest, and the previously referenced pricing equations are now yielding absurd results. The market for bonds is freezing up, with pricing models entering uncharted territory. One thing is certain, the bond bubble, along with the stock bubble, has popped.

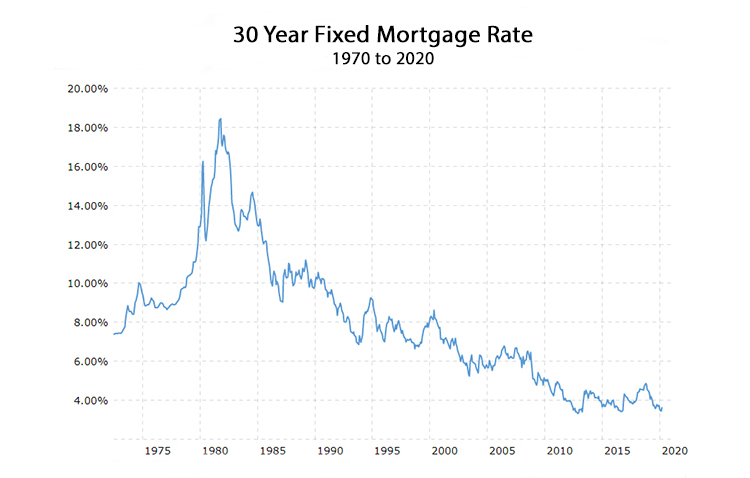
Which brings us to real estate, the third major asset class that the permabears allege has entered bubble territory. Unlike stocks and bonds, real estate is a tangible asset. While real estate isn’t finite, since the square-foot inventory of real estate perpetually increases, there are practical, physical limits on the growth or shrinkage of real estate inventory that, at least compared to stocks and bonds, puts a floor on how far its value can crash. But real estate still obeys the same law of leverage; when falling interest rates lower the cost of money, more borrowers increase the demand and prices rise.

As can be seen on the next chart, however, when it comes to the 30-year fixed mortgage rate, we’re back to those “lifetime lows” that preceded the last crash in real estate values in 2008. As an investment, it is likely that real estate values will continue to hold in the U.S. markets where there is global demand from foreign investors—the California coast, New York City, Miami. U.S. real estate in general will benefit from foreign investment—assuming it is not restricted—as foreign capital seeks the relative stability of owning property in the United States. But broad American consumer demand for real estate requires Americans to retain a capacity for borrowing, a capacity which can no longer be expanded by lowering mortgage lending rates. They are about as low as they can go.


What does it mean when asset portfolios can no longer offer returns that interest investors? What happens when the value of stocks and bonds fall by trillions of dollars overnight? These questions, urgent enough on their own, are compounded by the fact that while the super bubble only required a pin-prick to pop, the COVID-19 recession is more analogous to a wrecking ball than a pin. What’s going to happen?

For about 40 years, America’s economic growth has been stimulated by gradually lowering interest rates and increasing debt. How much debt can a nation handle? How does the burden of interest payments impact the ability of businesses to pay their operating costs and the ability of consumers to engage in ongoing borrowing and spending?

A good way to measure the ability of a national economy to handle their debt burden is to look at all debt—public and private—and compare that to GDP. The next table shows that relationship.

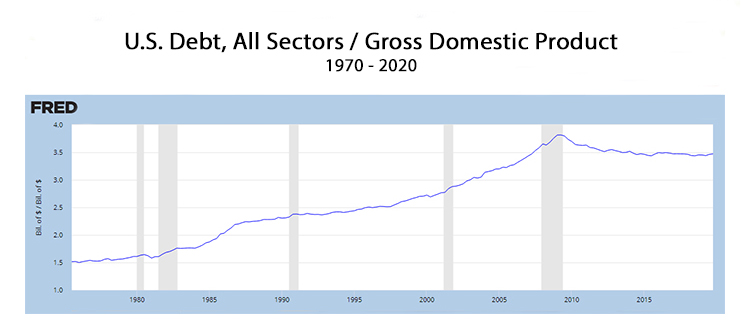
It’s difficult to overstate the importance of this relationship, because the ability of a nation to borrow depends on its income, just as an individual consumer’s ability to borrow depends on their income. As GDP grows, borrowing capacity grows. As shown above, while U.S. GDP has surely grown over the past 50 years, the amount borrowed has grown faster. Back in 1980, total borrowing in the United State was only 1.5 times GDP. This would be comparable to a person back then earning $50,000 per year, and owing a total of $75,000 for their home mortgage, automobiles, and whatever else they’d bought on credit. That’s not an alarming ratio.

The trillion-dollar question today is what is an alarming ratio?

What’s interesting is that the most recent ratio reported by the Federal Reserve, with total debt about 3.5 times GDP, is actually down from a high of nearly four times GDP in 2009. With the value of all debt in the United States currently at $75.5 trillion, over a reported 2019 GDP of 21.4 trillion, this suggests it would be possible to issue up to $10 trillion of new debt merely to reach the 4.0 ratio of debt-to-GDP we nearly reached a decade ago.

Once you accept the heretical notion that all debt is equal, that it doesn’t matter which balance sheet holds the debt, then you might consider the vitality of the U.S. economy as if it were a household. Can a household with an income of $50,000 manage a debt of $200,000? Yes. Easily. But there’s much more to this story.

The Primacy of Collateral

As in 2008, the Federal Reserve right now is preparing to purchase debt by issuing credits to banks and other creditors. This time, however, the Federal Reserve intends not only to purchase U.S. Treasuries and government-backed mortgages but also private debt. The goal is to stabilize the bond market and other financial markets, fund government payments to citizens and businesses that have been sidelined indefinitely by the COVID-19 pandemic. This explains where the federal government is getting $2 trillion to spread immediately into the economy.

The ability of the Federal Reserve to print money, along with fractional reserve lending and federal budget deficits, are all practices that invite condemnation from fiscal conservatives. Debating whether enhanced liquidity, investment, and economic growth is worth enduring the inherent risk of these financial innovations is a fascinating exercise. It’s also futile, because they’re here to stay. And what fuels financial innovation, the engine of liquidity, is collateral.

The collateral of the United States is incalculable, but there are abundant clues. According to the Federal Reserve’s most recent Financial Accounts Report, the total value of all financial assets in the United States in 2018 was $244 trillion. This certainly doesn’t include everything of value in the nation, and with that, it’s useful to consider the collateral of the United States as compared to that of any other nation.

Step way back for a moment and imagine if a fleet of extraterrestrial investors swept into earth orbit and decided to buy the planet. Imagine they negotiated with each national government, paying them all in some intergalactic currency. How would the inherent value of everything in the United States—land, natural resources, universities and hospitals, intellectual property and infrastructure, everything—compare to similar assessments made in other nations? It’s a safe bet that America’s collateral would fare quite favorably in such an appraisal.

There is a sound argument that balance sheets for the various sectors of the U.S. economy can be linked. Shifting debt from consumers and banks to the government, and from the government to the Federal Reserve, doesn’t change the overall national economic health. One cannot reference the consolidated total debt awash in the U.S. economy, $75.5 trillion, in all sectors, without considering the total value of the U.S. economy, easily in excess of $244 trillion. That is not an unhealthy ratio.

The current decision by the Federal Reserve to create as much money as it wishes in order to protect the government, financial, commercial and consumer sectors of the U.S. economy from going into deflationary default is logical and necessary, even if it may be heretical to fiscal conservatives.

The U.S. economy right now, and the global economy, exists on a razor’s edge between inflation and deflation. Of the two, deflation would be far more catastrophic, because deflation would reduce income and inflate the real value of debt. Deflation would make it impossible for debtors to pay their interest, putting them in default, crushing demand, bankrupting creditors at the same time, and collapsing national collateral. It must be avoided at all costs.

If You’re to Spend Money You Don’t Have, At Least Spend Wisely

America’s ability to print money isn’t unique. Every currency union in the world relies on what the purists derisively refer to as “fiat money.” Nations concoct currency out of thin air, turning it into either printed notes, or electronic transfers. Currencies are no longer backed by precious metal or any other commodity. Their value is based on the willingness of buyers and sellers to trade those currencies for other currencies, and at what rate of exchange. This is how money moves in the world, and despite the enthusiasm for cryptocurrencies or the perennial warnings from the gold bugs, it isn’t going to change anytime soon.

For this reason, America’s currency remains likely to stay strong despite the decision of the Federal Reserve to inject $10 trillion, or even $20 trillion, into the U.S. economy. The Federal Reserve has even offered to inject U.S. dollar liquidity into foreign central banks, in a move that will help their liquidity at the same time as it further solidifies the position of the U.S. dollar as the global transaction and reserve currency.

Skeptics should ask themselves how exactly will the U.S. currency devalue versus other currencies, and if so, how would that harm the U.S. economy? The debt-to-GDP ratio of China, America’s emerging competitor, is now 300 percent of their GDP, comparable to that of the United States. It is unlikely, however, that China’s debt-to-collateral ratio is as healthy as ours.

China, for all its dynamism, is a thin pan on a hot fire. In the long run they face demographic collapse, political instability, and dependence on imported fuel. Their cultural soft power is poor and getting worse. Nobody wants to live in a world dominated by the Chinese regime—not even the Chinese! As for the European Union, much like the Chinese the Europeans face demographic stagnation, political instability, and require imported fuel. There are no other economies big enough to muster a currency even remotely competitive with the dollar.

National collateral is not just physical and financial assets—it is the cultural vitality and political coherence and demographic resilience of a population. This intangible collateral influences the value of a currency as much as the physical collateral, and in this intangible category, America has collateral to burn. No other nation even comes close.

And if the dollar did devalue, so what? Americans would have to import less and export more. Jobs would be created. Investment would refocus within America’s borders. Wages would rise commensurate with prices. What exactly is the downside of a weaker dollar?

In the long run, though, critics have a point. What America’s Federal Reserve has been doing, and is now doing more than ever, is the most impudent application of Modern Monetary Theory in the history of the world. The only way it can be sustained is if genuine economic growth consistently exceeds the growth of debt. Forever. This is not a certainty, even in the short run.

How long the Black Swan in the form of COVID-19 remains perched on our economic doorstep is an open question. How soon it flies away will determine how soon economic growth can resume.

In the long run, what guarantees GDP growth is not financial engineering, but real growth in productivity and output. America’s GDP growth over the past 50 years was fueled not only by debt accumulation, but also by the inordinate expansion of America’s financial sector, and by the artificial expansion of borrowing collateral due to foreign investment and overregulation which creates artificial scarcity. The housing market in California is a perfect example of this.

The best path forward is managed, moderate inflation, a stable currency, and a refocusing on genuine economic growth instead of growth in the financial sector. For this to happen, some if not most of these magically materializing trillions of dollars need to be directed into public and private investments in enabling physical infrastructure, research and development, aerospace and military technologies, pure and applied physics, and medical breakthroughs.

The worst thing that could possibly happen is to see all that money squandered on stock buy-backs, pension fund bailouts, much less “green” schemes and new bureaucracies to enforce “diversity.”

America is at a crossroads economically. The immediate challenges are daunting. But the good news is America remains well positioned to lead and inspire the world in the 21st century. How that happens is up to us.

This article originally appeared on the website American Greatness.

 *   *   *