The Empathy of Competition

It isn’t as if anyone isn’t able to hear the warnings of the reactionaries or feel the resentments of the radicals. But beyond both legitimate fears and illegitimate hatreds is a deeper bond among humans that no messenger of tribalism or religion or race or national patriotism or even privilege can erase – the empathy of competition.

We see it in the Olympics every two years, as they alternate between summer and winter games, and take us all to every corner of the world. We see these games attract athletes from every nation and engage the passions of the world.

An even better example of this empathy of competition would have to be the World Cup soccer tournament – or football – as the rest of the world calls the game. Nearly every nation sends a team, with 64 surviving the qualifying rounds. Every fourth year, as spring comes to an end and on through the summer solstice, through even U.S. Independence day on the 4th of July, the tempers and timelines of the world run a mite slower, as billions of people dedicate hours – in countless cases every hour they can spare – to following this greatest of global tournaments.

On Friday July 2nd a very tired team from Uruguay eked a hardfought and lucky decision over an inspired team from Ghana, in a match that exemplified the intense drama of all the games. With overtime expired and one kick left, the Uruguayan defenders desperately repelled shots at the goal, until finally the ball was deflected by the upstretched hand of a defender – not the goalie. The ensuing penalty kick was missed, and the game went into a sudden death where each team is given five penalty kicks. Uruguay edged out on top, hitting four out of five, and Ghana was dealt a heartbreaking and unexpected defeat.

Later that day I discussed this game with the cashier at a corner store where an overhead television was showing a rerun of the Netherland’s victory over Brazil, another upset that surprised the world. Recapping the surprising victory of the Uruguyan team elicited chortles of amazement from both of us. And we shared this spontaneous World Cup camaraderie despite being total strangers, despite our lineage originating from opposite hemispheres, despite whatever madness and antipathy might infect various fighting factions in his land or mine. The empathy of competition.

You can see this empathy in the eyes of players who have spent every ounce of energy they could store, when their passion has all been poured onto the field of play. And in the exhaustion of passion comes the empathy of knowing you could have been the victor or the vanquished, and every game is another opportunity to prevail. You see empathy in the exhausted eyes of the winner shaking hands with the loser. You see it in the mutual respect the players earn when they give it their all.

The harsh reality of competition in the world of business and money might suggest that the empathy and character that is forged on a sporting field cannot be earned and rewarded in the real world. But this suggestion would be wrong, for reasons that are as essential to understanding the beautiful aspects of capitalism as they are unheralded. Empathy is the mitigating redeemer of competition as an activity with moral worth. And competition – the pursuit of individual and collective self-interest – is inevitable. The challenge of capitalism is not whether or not to choose it, but how to regulate it, because no other system of political economy embraces competition. Capitalism at its core is a uniquely practical system that doesn’t deny the human urge to compete, but indeed depends on it.

The empathy that is earned by athletes in sports is completely transferable to capitalist competition – the businessperson who empathizes with their counterpart can navigate the negotiations of the marketplace, the sportsmanship that informs a game can translate to commercial exchanges; the line between empathy and enlightened self-interest is fine indeed. And within the framework of capitalism are winners and losers – with only empathy to guarantee the rules of the game stay fair. Decidedly not least, unlike sports, capitalism doesn’t merely produce winners and losers, but winners and winners, as capitalism creates wealth and opportunities for all, and not merely a zero sum game of win or lose.

The empathy between athletic competitors, the fair-minded channeling of passions in sports, where it is still possible to view these titanic bouts as pure expressions of sportsmanship, teamwork and individual excellence, is an empathy that not only extends to capitalist competition but is needed now more than ever, because empathy is challenged by other factors as never before.

Conventional indexes of empathy among young Americans are at all-time lows, and various theories attempt to account for this. Most prominent is the theory of the internet impact, which has encapsulated individuals in virtual realities, where friendships are acquired and discarded effortlessly, where individual accountability hides behind aliases, and identities and reputations are earned without sweat or consequences, but rather by tapping keys.

Another theory attributes the decline in empathy to multiculturalism in America, where the conventional wisdom taught in public schools now tends to marginalize the traditional American identity and values, and teaches that all cultures and values have equivalent worth. One may decry or defend multiculturalism, but teaching empathy to children is harder when the American identity is in such rapid transition.

Empathy is also under attack by the very blessings that have made life so much more interesting and secure in the developed world, through mushrooming and perpetually transformative new technologies. Where is empathy when the icons of our existence, the furniture of our lives, are completely exchanged for newer and better gadgets every decade or two? Can an alert octogenarian, whose formative years were spent marveling at the wonders of AM radio, easily distinguish between a browser and a search engine? Can empathy overcome the reality of revolutionary new technologies emerging every few years, shredding our interactive fabrics before we’ve even finished installing them? Can empathy cross generations thirty years removed, when new technologies completely redefine how we live every ten years?

This is today’s empathy-challenged milieu that demands the empathy of competition receive recognition as the mitigating, moderating core value of capitalism, because capitalism embraces rather than denies competition. Capitalism is the only system that doesn’t deny the innate competitive urges that forged our spirits, as we emerged from being merely participants in nature’s ruthless food chain into a technologically advanced, urbanized species.

Only capitalism leaves wholly intact the opportunity for every human being to compete, to win, to acquire, to bequeath, to empower themselves. Only capitalism can enable and inform a world of pluralistic, channeled, and empathic competition. Like nature itself, capitalism creates winners and losers, but within this harsh framework, capitalism preserves incentives and maximizes overall wealth.

If anyone might still believe that capitalistic competition isn’t worth encouraging, or that embedded hatreds and the warlike momentum of millennia are ineluctable, or that it is better to seek refuge as members of a select and anointed few, then explain the empathy that saturates humanity as nations compete in the World Cup. Explain the transcendent joy of this simple game that animates everyone. Explain this connecting empathy of peaceful competition, and wonder if maybe this spirit might extend to real life and commerce, and inspire a calming path for our tumultuous world.

Headcount Cuts vs. Compensation Cuts

California is on track to have 2.0 million people working for state and local government. According to 2008 U.S. Census data (ref. 2008 Public Employment Data, Local, and 2008 Public Employment Data, State) there are 1.85 million non-federal government workers in California today. It is becoming increasingly understood by voters and policymakers that a worker’s compensation is not adequately measured simply by referencing their annual salary or total annual wages. Overtime, sick time and vacation time payouts, health benefits, preferred access and rates for loans and insurance, transportation reimbursements, and more, are all examples of current year compensation that belong in any properly compiled estimate of a worker’s total annual compensation. And a heretofore arcane yet huge component of any worker’s total annual compensation is the current year funding requirements for future benefits – such as their retirement pension and their retirement health benefits.

In an analysis posted earlier this year entitled “California’s Personnel Costs,” the average total compensation for state and local government employees in California was estimated at $94K per year. In reality we feel this amount is still significantly lower than the true average because (1) public employee retirement pension funds are below the asset value necessary to ensure long-term solvency and therefore current-year payments into them on behalf of public employees will need to be further increased, and (2) assigning a value of $10K per year for the average current benefit package is probably too low, particularly when you take into account the extra vacation, other paid time off, and other reimbursements afforded public sector employees, and (3) the analysis did not take into account current-year funding requirements for any supplemental retirement health benefits. For these reasons, the default assumption on the interactive spreadsheet table below is an average total compensation for California’s state and local employees of $120K per year.

In the analysis below, the input assumptions are highlighted in yellow. These assumptions can be changed by any viewer, simply by clicking the cursor onto one of the yellow input cells and changing the number in the cell, then hitting the “Tab” key. The entire table will recalculate.

As the table is currently configured, 2.0 million workers making $120K per year would cost $240 billion per year – which is roughly 50% of California’s total state and local budgets combined. The remaining two assumptions on the spreadsheet allow the user to input percentage reduction scenarios both for the number of workers and the amount of average annual compensation. As can be seen, a 20% reduction to both the number of workers, as well as to the rate of compensation for the remaining workers, yields a total reduction of 36%, or $86 billion per year. This scenario is what I would like to call California’s “20% Solution.”

(enter new quantities in any yellow cell; to calculate, click cursor within any yellow cell, then move cursor off cell and click again)

If you consider what a solution like this would entail, it is important to note the cost should not include any draconian cuts to services, nor to the viability of earnings to employees who keep their jobs. Since most public employees have been getting nearly every Friday off, a 20% workforce reduction would simply mean that the remaining workers would have to work five days a week again. Reducing their generous holiday and vacation allotments incrementally – certainly not by 20% – would serve to easily build up worker attendance to a level sufficient to guarantee ongoing government services at the level they’ve been traditionally available.

Similarly, the 20% solution makes a reduction to compensation packages relatively easy to attain. Since public sector workers have already seen their direct compensation cut by virtue of getting nearly every Friday off without pay, all that is necessary is to put them back onto a full-time schedule without increasing their pay proportionally, then cut back on their benefits – current and future – enough to achieve the full 20% reduction in total compensation. The only area where a genuine hardship is inflicted is in the case of the workers who are laid off, which would be nearly 400,000 state and local government workers. But the question must be asked – if our state and local governments can continue to function with the actual labor hours lowered by one day per week – as the furlough Fridays has proven – then why should taxpayers continue to support these unnecessary jobs?

Using this interactive spreadsheet, however, one may input any variables they wish. Suppose you wanted to save $86 billion per year but didn’t want to lay anyone off? Then lower every state worker’s total compensation by 36% and you accomplish an identical level of savings. And you still have an average public employee compensation set at $77K per year, which is pretty good. For example, if you simply required public sector employees to collect social security and medicare instead of providing them pensions and supplemental retirement health care (that ordinary taxpayers have to become millionaires to ever hope to match), you could probably afford these reductions with NO reduction to any public employee’s current compensation. Alternatively, of course, some departments could be privatized, or eliminated selectively, ameliorating the hardship of headcount and compensation reductions elsewhere in the public workforce.

The value of an interactive spreadsheet is it defines and quantifies the immutability of the constraints we’re under. State and local governments have borrowed as much money as it is financially feasible for them to borrow. The Federal government can still borrow money to bail out the state and local governments, but that, too, is financially unsustainable and is encountering increasing resistance from concerned taxpayers. And speaking of taxes, it is ridiculous and futile to think California’s private sector workers are going to accept more taxes when Californians are already one of the most taxed states in the U.S., just so their public sector counterparts can continue to enjoy compensation packages that are, on average, at least twice as lucrative as these taxpayer’s own earnings in the competitive private sector. The choice is reduced to two hard variables – total headcount and average compensation. Hopefully these painful reductions will be made with humanity and wisdom.

U.S. Senate to Force Unionization of Police?

Within the next few days the U.S. Senate may consider Senate Bill 3194, the “Public Safety Employer-Employee Cooperation Act,” that will require states to grant collective bargaining rights for all public safety workers, including police, firefighters and emergency medical workers.

Residents of California have had a front row seat to witness the consequences of allowing unrestricted collective bargaining by public employees. It is increasingly arguable that the root cause of many of California’s most serious problems – the insolvency of the State and most local governments, and the mediocre public school system, to name two big ones – are because of the influence of public sector unions. And public sector union control over California’s State government, which most insiders will acknowledge is “absolute,” is matched by union control over California’s county and city governments. Now we’re going to export California’s problems with public sector unions to the rest of the United States?

A report written by Kris Maher for the June 17th, 2010 Wall Street Journal entitled “Bill Gives Public Workers Clout,” quotes the Executive Director of the 325,000 member National Fraternal Order of Police, Jim Pasco, who said “unions wouldn’t be able to negotiate wages and benefits that governments couldn’t afford.” It’s interesting to wonder how Pasco can justify this statement, because if history is any indication, the opposite is going to happen.

As documented in “The Price of Public Safety,” in California, it is already common to see public safety workers earn, on average, over $200K per year in total compensation. Much of this compensation has to be used to meet current year funding requirements for their future pensions, because these pension funds today are almost universally insolvent. California’s local government entities are cutting virtually all other government services, including road maintenance, libraries, and public health programs, in order to free up enough money to pay compensation and benefits for their public safety workers.

The fiscal crisis facing public sector entities isn’t merely because of unsustainable compensation and benefits being paid to public safety workers, however, it only begins there. Once the other public sector employees see the political clout and the financial compensation the police and firefighters are acquiring, they too will unionize, even if they haven’t already. At this point you are set to experience California’s plight – where nearly every government employee is overpaid, and consequently nearly every government institution in California is facing possible bankruptcy.

Without a strong set of regulatory checks, allowing public sector workers to unionize creates an unfair political environment, where public employee unions collect mandatory dues – paid for by taxpayers – to amass literally hundreds of millions of dollars to use for political activity. Public employee unions routinely outspend fiscal conservative reformers by ratios of 5-to-1, or even 10-to-1, or more, essentially using taxpayer’s money to advance their agenda, which is bigger and bigger government to create more union jobs, and higher and higher rates of compensation for unionized government employees. Unionized government results in government employees, through their unions, purchasing our elections and hence our elected officials, who then decide on policy matters affecting the compensation and benefits paid to government employees. For this reason, and for the reasons stated below, national legislation should aim at reforming public sector unions, not expanding them.

Why unionization of government workers is a threat to the solvency of America’s Federal, State and local governments, as well as a corrupting influence on the democratic process:

  • Civil service protections already available to government employees make union membership redundant.
  • Government employee unions collect membership dues, funded by taxpayers, and use it for political activity without the consent of the taxpayers and often without the consent of the individual government workers.
  • The automatic transfer of taxpayer funds – via membership dues – into union coffers gives public sector unions an unfair financial advantage in political campaigns.
  • Public sector unions have used their ability to buy elections and control politicians to negotiate financially unsustainable, over-market rates of compensation for public employees.
  • The effectiveness of public agencies has been compromised by work-rules negotiated by unions that prevent, for example, efficient allocation of worker hours or ability to terminate incompetent employees.
  • Private sector unions must, ultimately, negotiate in good faith with their companies, or they will destroy the competitiveness of the company. Public sector unions have no such constraint – and the results are already clear – unprecedented government deficits and debt.

Most everyone respects and appreciates the services performed by public employees, especially those working in public safety. Calling for reform of public sector unions is not personal, it a matter of restoring fiscal sustainability and the integrity of our democratic institutions. Moreover, concern over the unique dangers public sector unions present is not to take issue with unions in the private sector, which at least operate in a somewhat self-regulating environment. Finally, concern over the excessive power of public sector unions does not necessarily equate to an excessively libertarian ideology – many of us would like to see more government investment in our economy. But currently much of our federal deficit spending is being wasted to pay grossly over-market wages to government employees instead of being used for strategic investments that will yield long-term returns to society, such as scientific research, upgraded infrastructure, and military security.

Whether or not unions should be allowed to operate at all in the public sector is debatable. But at the least, if unions are going to be permitted to organize public employees, there should be curbs on their ability to (1) compel any public employee to join a union against their wishes, and (2) compel any public employee to allow any portion of their union dues to be used for political activity against their wishes. Unless checks of this sort, at the least, are part of the package, Senate Bill 3194 is a very bad idea.

The Price of Public Safety

There is nothing wrong with paying a premium to public safety personnel because of the risks they take. And while it is true there are other career choices that are riskier than public safety jobs, and while it is also true that on average, public safety personnel in California – according to CalPERS own actuarial data – have life expectancies that are virtually the same as the rest of us, it is still appropriate to pay public safety personnel a premium. After all, we never know when these people may stand on the front lines when something extraordinary happens – such as what occurred in New York City on Sept. 11th, 2001. People who work in public safety live with this knowledge every day, and they should be compensated appropriately for that.

The question is how much of a premium is appropriate, and how much of a premium can we afford as a society? Should a fire fighter make more than a medical doctor? Should a police officer make more than an engineer?

In order to get an idea of what public safety employees in California actually make, I obtained a roster that showed the total compensation paid to each employee of a Southern California city. Out of respect for the employees noted on this roster, I won’t identify the city, much less reveal the names of these individuals. And it is fair to state this city probably has a median income somewhat higher than the average for California. It would certainly be interesting as follow-up to obtain this sort of information for other California cities. But even taking all of these factors into consideration, the amounts these folks are making is startling – particularly when you adjust for realistic current year funding obligations for future retirement health and pension benefits.

In our example city, using actual data, the fire department has about 100 full time positions. The average annual compensation for these firefighters, if you include current benefits and current funding for future benefits, is $179K per year. But it doesn’t end there, because the pension funding percentage is calculated at 34% of earnings. As argued in “Maintaining Pension Solvency,” if you calculate pension funding requirements for a safety employee in California based on after-inflation returns of 3.0% instead of CalPERS official rate of 4.75%, you need to increase the pension withholding as a percent of payroll by 20%! Making this adjustment yields an average firefighter compensation of $202K per year. And even this figure probably fails to adequately account for current funding requirements for future supplemental retirement health benefits.

For our example city’s police department, using actual data, the police department has about 150 full time positions. The average annual compensation for these police officers, if you include current benefits and current funding for future benefits, is $174K per year. If you increase the pension withholding percentage by 20%, in order to reflect realistic rates of future pension fund returns, you will calculate an average police officer compensation of $197K per year – again, probably not including enough to fund future supplemental retirement health benefits.

It is important to emphasize these amounts – roughly $200K per year each – are not for senior management, or even senior employees. This is the average, taking into account entry level public safety employees as well as senior public safety employees.

It is interesting to note what the rest of the employees, the non-safety personnel, make in our sample city – making the same adjustments, their total compensation averages $118K per year. That is still quite a bit, considering many of these jobs are relatively unskilled. To put this in perspective, the average private sector worker in California averages $40K per year in compensation – one third what the non-safety workers average in our sample city.

Should a non-safety local public employee workforce, one including a large percentage of relatively unskilled positions, have an average compensation per employee of $118K per year? Should safety employees make, on average, $200K per year? Can we afford this?

What is clear over the past several years is that as pay stagnated in the private sector, public sector employees continued to receive regular cost-of-living increases. Over the past 10-15 years, public employees also received dramatic increases to their retirement benefits. And as housing prices soared, millions of Californians borrowed against their home equity, and many of them are now paying dearly for that mistake. There are undoubtedly many public sector employees who were caught up in the borrowing frenzy, and are now on the edge financially – but it is fair to wonder why they should be immune from the same cutbacks that have left so many people in the private sector unemployed, or under-employed, or compensated at rates that are a fraction of what they were during the bubble booms.

It is also fair to wonder why public sector employees should not be obligated to plan and prepare and save, if they want a comfortable retirement. For non-safety personnel in public service, it is fair to wonder – since they now make more, not less, than private sector workers for similar work requiring similar skills – why in their retirement they shouldn’t simply collect social security and medicare like the rest of us. And even if public safety employees should collect something better than social security in recognition of their role as first responders, it is fair to wonder why their retirement pensions should be literally five times more than the social security payments due retired private sector workers with similar salary histories. As documented in “Funding Social Security vs. Public Sector Pensions,” the fiscal crisis facing social security is trivial and easily solved, whereas the fiscal crisis facing public sector pensions is catastrophic and can only be solved either through massive benefit cuts or crippling new taxes.

It is difficult to dispute the contention that the price of public safety cannot be too high. It is difficult to overstate the appreciation anyone should feel for people who stand between us and chaos – the people who protect us, the people who rescue us, the people who save our property. But those people themselves should understand the price we’re currently paying is elevated because of collective bargaining and overwhelming political clout, and is dangerously out of touch with market realities. It would be helpful for everyone to consider the choices involved – cuts to pay and benefits vs. cuts to services, cuts to pay and benefits vs. crippling taxes and economic decline, cuts to pay and benefits vs. investments to advance our technology, our infrastructure, and our military security. All of these elements must be balanced, yet are currently grossly out of balance, because in one way or another, all of them may quite legitimately be described as issues of safety and security for California and the nation.

Logic and Emotion in Politics

Winston Churchill’s famous quote on this topic goes as follows: “If you’re not a liberal at twenty you have no heart, if you’re not a conservative at forty you have no brain.” Depending on your political persuasion this is not necessarily the most endearing polemic to lead off with, but it certainly frames the issue. Are fiscal liberals governed primarily by their emotions? Are fiscal conservatives governed primarily by their logic? There are countless ways to examine this – to wit:

Did the entirely valid emotional desire to see financially less-fortunate families become homeowners create the edifice of sand upon which the financiers of Wall Street built their derivatives house of cards?

Did the hyper-literate, ruthlessly logical calculations of economists and bankers – who thought they had mastered the art of risk management – completely backfire on them? Was the forest of fundamentals obscured by trees of logic?

In the above set of scenarios, emotion and logic both backfired, but a cynic would disagree with both assessments. A cynic would suggest policymakers knew perfectly well their attempts to sell homes to anyone regardless of their earnings or credit history was bound to fail, and that they pushed these manifestly irresponsible policies because they were taking money off the table the whole time. A cynic would make a similar claim against the Wall Street folks – that they knew the whole scheme was going to crash, but they collected their bonuses, bet against their own clients, concocted elaborate models that obfuscated the otherwise obvious financial chicanery of it all, and laughed all the way to the bank.

The point so far is perhaps this – logic is an amoral, bipartisan phenomenon that can be put to use for good or ill, and logic itself is no guarantee of accuracy, just an essential tool to help us hopefully be more accurate than we might otherwise be. And to the extent emotion governs politics, it is generally sincere, whereas logic is only an emotionless tool. Evidence suggests, overwhelmingly, that in a democracy, emotion is a far more powerful political weapon than logic. But sincere emotional appeals that aren’t vetted with logic can be dangerous. Our financial crisis that was enabled by a sincere emotional desire to empower poor families – and to embrace free market principles – is not the only example of valid emotional imperatives producing bad results.

  • We emotionally respond to the desire to help the poor, and instead create huge self-interested bureaucracies of overpaid taxpayer-funded unionized public employees, whose programs create a cycle of dependency and further harm the people they are supposedly going to help.
  • We emotionally respond to the desire to protect the environment, and instead tie all land development and resource development up in knots of regulations and lawsuits, undermining our economic growth and personal liberties.
  • We emotionally respond to the desire to provide health care to everyone, and instead create a new layer of government bureaucracy, drive capable doctors and other health practitioners out of the business in disgust, grossly increase rates of health insurance for people who can barely afford what they’ve already got, challenge the ability of medical device manufacturers to stay in business, reduce the amount of private research, and ultimately, slow the rate of growth and the rate of innovation across the entire health care industry.

Do we need to help the poor, protect the environment, and reform health care? Of course – but we need to first ensure that sincere emotional motivation has not been hijacked by coldly logical cynics for personal gain, or has been passionately embraced by so many people that cautionary logic is swarmed under and insufficiently employed. Logic takes time. Logic is cold. Logic is heartless. But only logic can ensure a well-intentioned policy will have its intended effect.

In a commentary by Daniel Klein entitled “Are You Smarter Than a Fifth Grader,” published in the June 8th, 2010 edition of the Wall Street Journal, some interesting data on this divide between logic and emotion in politics was presented.

Klein cited a Zogby International survey that attempted to measure the economic literacy of the respondents, and then correlated their answers to whether or not they self-identified as either Very Conservative, Libertarian, Conservative, Moderate, Liberal, and Very Liberal. The poll had eight questions that tested the respondents understanding of supply and demand, free trade, and other basic economic concepts. In some cases, particularly with the two questions centered on free trade concepts, one may allow for some remaining debate on what might be the right answer, but the results nonetheless showed a sharp divide, with Conservatives and Libertarians scoring four times better than Liberals in terms of the number of answers they got correct.

Does such a test conclusively demonstrate that logic is more likely to inform the policy preferences of conservatives, and emotion is more likely to inform the policy preferences of liberals? If so, it would explain a lot. But asking such a question or making such a generalization is futile if, at the same time, the emotional dimension of enlightened altruism vs. cynical opportunism as the motive for a policy preference is not equally explored.

In an earlier post entitled “Fiscal Conservatism is Social Justice” this concept is developed further, and is summarized as follows:

The left has a rhetorical advantage because their policies are so easy to cloak in virtue. Does this advantage make the left the magnet for the sinners, the opportunists, those with no virtue – their ability to prevail politically merely because they can more easily tar and feather the right with the unjustified but easily applied stigma of having no altruism, no empathy? Ponder this need to redefine the perceived premises of left and right, before descending into the details of the debate. We all want the same things.

Without emotion, logic is rudderless and heartless. Without logic, emotion is a potent, capricious hydra, capable of utterly destroying productive institutions as often as it reforms or refines them.

Fiscal conservatives need to learn to express the altruistic heart that informs any policy they espouse, especially when they must otherwise depend on the financial literacy of their target audience. And perhaps fiscal liberals need to take classes in finance, and resist the all-too-normal tendency to become overwhelmed by the emotional appeal of their cause.

The China Bubble

With over a billion people and an economy poised to surpass Japan’s as the 2nd largest in the world, it seems everything that happens in China has an oversize impact on the rest of the world. So what if China’s economic growth turns out to be as reliant on inflated collateral and unsustainable debt as the Europeans or the Americans? Is there a China bubble?

A recent report on CBS “60 Minutes” provided visceral evidence that formation of a real estate bubble is undoubtedly already well underway in China. The report showed entire cities in China’s northeast that were newly constructed and completely unoccupied. This anecdotal evidence is backed up by other reports, such as noted by fund manager Jim Chanos in an interview on Charlie Rose on April 14th, 2010. In the transcript, “Jim Chanos on China’s Property Bubble: Charlie Rose Interview,” Chanos is quoted as saying “The fact of the matter is the game [real estate speculation] has to keep going…because so much of their GDP growth is in construction…50% to 60% of China’s GDP is in construction.”

The more you dig, the more it appears China is not just starting to inflate their real estate bubble, but that China’s real estate bubble is about to pop. China is doing almost exactly the same thing the Americans did – and the fact China has stricter regulations on mortgage lending, with between 30%-50% down payments required on real estate purchases – has not slowed the growth in real estate asset values, the rate of new construction, or the growth in residential and commercial vacancy rates. Go all the way back to 2007 for these statistics from The China Expat, in the report “China Housing Bubble Late 2007 Update:”

“Apparently, housing prices in Suzhou averaged about 500 RMB per square meter six or so years ago. Now, the average seems to be hovering around 7-8000. A rise of 14-16 times, which is even greater percentage wise than the increase in Shanghai housing prices… At the low point in the late ’90s, much of the prime real estate in Pudong [Shanghai] was selling for 1000-2000 RMB per square meter. Today, decent real estate in Pudong starts at 13,000 RMB per square meter. Residential apartments near the famed Oriental Pearl Tower goes for over 100,000 RMB per square meter.”

If you run the numbers, a 14x appreciation in the six years between 2001 and 2007 equates to a 55% increase every year. Fast forward 2.5 years to the present – how much more appreciation has occurred?

In a USA Today report from April 24th, 2010, entitled “If hot China real estate market stumbles, will USA get bruised?,” here is evidence that China’s real estate asset appreciation hasn’t begun to slow:

“Real estate prices have risen for nine consecutive months in China, making home purchases unaffordable for a growing number of white-collar workers. Among large cities, commercial and residential prices in Shenzhen — known as much for its wealth as its seemingly boundless growth — have gained the fastest, rising nearly 21% in the 12-month period ended in February. Overall, the most dramatic jumps are in Sanya, a resort city in southern China where property prices were nearly 50% higher in February than a year earlier, according to the National Bureau of Statistics. Analysts believe that China’s official data likely understate the price increases.”

The same USA Today report also has some good information on what prices actually are for real estate in China, as well as information on vacancy rates. Consider these nuggets:

“At the Curio — one of the most expensive new buildings in the city [Shenzhen] — buyers can purchase a nearly 2,400-square-foot apartment for $1.9 million. In the USA, that amount would buy a 2,400-square-foot beach house in Santa Cruz, Calif., a 12-acre New England farm in Sharon, Conn., or a four-bedroom pad near New York City’s Central Park.

In Shanghai and Guangzhou, the commercial vacancy rate exceeded 15% at the end of 2009. Meanwhile, in Beijing’s central business district, the commercial vacancy rate was 29.2%, while the citywide vacancy rate was about 20%, according to real estate broker CB Richard Ellis.

A healthy vacancy rate for Beijing would be around 10%, says Jack Rodman, president of Beijing-based Global Distressed Solutions, a property consultant. But he believes the city’s actual commercial vacancy rate is closer to 50%, after taking into account office space that’s been completed but isn’t on the market. To get back to a normal occupancy rate could take 15 years, he estimates.”

In a MoneyLife report entitled “The China real-estate bubble,” dated today, June 8th, 2010, the following data was provided:

“Depending on whose numbers you believe, real estate in 70 Chinese cities has risen between 12.8% to 18% over the past year and 95% in Beijing. To buy an apartment in Beijing would cost the average wage earner 17 years’ income.

To pay for these skyrocketing prices the amount of mortgages as a percentage of GDP has exploded from an average of 10% from 2005 to 2008 to 16%, while the amounts have tripled from 500 billion yuan to 1.75 trillion yuan. But is this a problem?”

This is a huge problem. If 50% or more of your economy is construction oriented, and real estate values have appreciated at 3-5x the rate of GDP growth for a decade, and GDP itself is tied to construction activity, this is indeed a huge problem. The large down payments required in China, 30-50%, are about as useless as minimal down payments or zero down payments, if the property suddenly begins to depreciate for more than a year or two at the same rate it once appreciated. So what if you have put 30% down, if your property has appreciated 50% in the year before you bought it?

As noted in the post “The Razor’s Edge – Inflation vs. Deflation,” collateral is wealth; collateral is currency; the ability of collateral – asset value – to create purchasing power simply dwarfs the impact of national fiscal and monetary policies – especially in the short run. Think of a nation’s fiscal and monetary policies as the helm and the rudder of a giant ship. Think of collateral as the ship itself. Point the ship at an iceberg for a thousand miles, and try to stop the collision when the ship is on a direct heading and 1,000 feet away. It can’t be done.

The United States experienced low double-digit rates of real estate appreciation for about five years, and is paying an awful price. The Chinese have now experienced mid double-digit rates of real estate appreciation for nearly twice as long. There is no doubt their real estate market will correct – to put it mildly. What does this all mean?

First of all, there will have to be some triggering event. In the U.S., the triggering event was basically when the buying frenzy began to slow down. Once prices stopped getting bid upwards, the searing light of day began to shine onto Potemkin Villages of overpriced and empty buildings from Miami to Las Vegas, and the party ended. Sooner or later, the Chinese are going to experience exactly the same thing.

Once this happens, China’s construction industry is going to shrink dramatically. With commercial and residential real estate nationwide already at 25% vacancy rates, there is no other option. And unlike the United States, where construction barely exceeded 10% of GDP even during the bubble, China’s construction industry is estimated to be at least 50% of their GDP. When construction falters, China is going to experience massive unemployment.

As China’s economy enters its version of the great recession, how the rest of the world adjusts is difficult to predict, but the effect may not be as dire as one might imagine. China has only in the past quarter become a net importer after years of massive trade surpluses, so few countries – certainly not America – are overly reliant on exports to China. And China’s GDP, despite having experienced miraculous (and unsustainable) expansion over the past 10+ years, is still only tied with Japan’s at around $5.0 trillion per year, compared with the U.S. and the European Union who both are about triple that size. China’s GDP only represents about 8% of the global economy. Given the economic turmoil that has already erupted in the U.S. and the EU, it is possible China’s economic slowdown will not catalyze further economic difficulties elsewhere. It will certainly take pressure off energy prices. The biggest risk is a China crash will contribute to global deflation, which remains the most terrifying bogeyman of all.

In America, unfunded liabilities and expanding debt present financial policymakers with a potentially ominous future. But America is watching the Europeans grapple with a debt-fueled meltdown at least as severe as America’s, because it is exacerbated by problems America doesn’t have – a strained integration of previously independent national economies, an entitlement-driven statism that America, at least so far, does not match, and a population aging far more quickly than America’s. And China also faces an inverting age demographic that is going to challenge them economically within the next 10-20 years.

China’s asset bubble going to burst, throwing them into a financial crisis and raising anxieties around the world. The real question is will America adapt and learn from the economic carnage witnessed elsewhere? America’s response in this scenario, where sudden economic downturns in China and the EU underscore America resilience, is an opportunity that cannot be missed.

The biggest risk of America reemerging economically amid relatively worse economic problems in the rest of the world is that their good fortune will be squandered, as structural reforms to America’s economy are deferred or abandoned in the face of a deceptively positive economic performance. America will still be able to print currency at will, borrowing additional trillions because even as a nation dealing with unprecedented debt, she still has the most diverse and secure economy on earth. Most crucially, America may delay reforming her public sector, using her ability to persist in massive federal deficit spending only to indulge in overpaying public sector bureaucrats – a hideous waste of deficit spending, which is properly used on infrastructure projects and technology initiatives that yield long-term strategic returns on investment.

America can use this coming decade of economic reprieve, purchased by more severe economic challenges in China and the EU, to make deficit-fueled but genuine investments that will secure her future economically, or America can use this opportunity to simply spend another decade printing borrowed money to pay excessive compensation to unionized public employees. Such a feckless act will inflate the mother of all bubbles, an American debt bubble of unprecedented and ever burgeoning magnitude that will progressively induce investment to gravitate to chastened, reformed and recovering foreign shores. A bubble fueled by irresponsibility and corruption, and ignored 2nd chances, whose cataclysmic burst will signal the end of the America era.

* * *

* * *

Sustainable Economic Returns

John Maynard Keynes, in his General Theory of Employment, Interest and Money, advocated deficit spending during economic downturns to maintain full employment. It is fair to say the theories of Keynes have been embraced by U.S. economic planners, and Presidents, for several decades – and each decade seems to have outdone the preceding one. But what sort of government deficit spending? During the 1930’s we built dams and power plants. During the 1950’s and 1960’s we built the interstate highway system and sent astronauts to the moon. During the 1980’s we invested in our military and won the cold war. These programs delivered a temporary stimulus to the economy, but they also yielded lasting benefits. The physical infrastructure, the strategic dividends, and the technological spinoffs outlasted the spending programs. There was a return on investment beyond the temporary stimulus – and this is the crucial difference between what we’ve done before, and what we’re doing now.

A good example of where deficit spending should go, but isn’t, is the F-22 Raptor, a fifth generation fighter that development began on over 20 years ago. Originally the F-22 was intended to replace the F-15, America’s current air-superiority fighter, and at least 750 of these advanced aircraft were supposed to be built. Today, with only 186 planes built, President Obama has canceled the F-22 program and their assembly lines are scheduled to be dismantled.

One would think the lessons learned during the Cold War – that deterrence depends on fielding an equal or greater military capability than your rival, or that national rivalries are real and enduring even into this age – would be remembered and acted upon. One would think the hard lessons of appeasement gone awry – such as when Chamberlain gave up the Sudetenland in 1938 and proclaimed “peace in our time” to the world – would also be remembered. One would think the benefits of investing in our high-tech military – the countless industries and amenities we have produced using technology that was once purely defense-related, from advanced composites to the internet – would be remembered. But apparently memories are short in Washington these days.

If you want to better understand what an amazing piece of technology the F-22 represents, an outstanding source of information is the article “The Sixth Generation Fighter,” written in October 2009 by John A. Tirpak, Executive Editor of Air Force Magazine. In this comprehensive summary of what the F-22 can do, Tirpak describes the generations of fighter development from the 1st generation, such as the German ME-262 which was the first operational jet fighter, through today’s advanced 4th generation fighters, which are actually characterized as Generation 4, 4+, and 4++. Today’s F-15SE fighter is considered a Generation 4++ fighter, and ranks with the Russian Su-35 as the most advanced fighter in the world. But the 5th generation F-22 offers more capability than 4th generation fighters in several important ways.

The F-22 has “all-aspect stealth,” meaning it has virtually no radar signature. All its weapons are internal, only deploying outside the skin of the aircraft when they are being launched or fired. It has extreme agility. It has “full sensor fusion,” providing the pilot with total awareness of the battlespace in all directions, and the ability to engage multiple threats simultaneously. It has “integrated avionics,” allowing a formation of F-22s to, for example, each shoot several missiles at targets and have the missiles interact to each identify a separate target. It can “supercruise,” which means it can fly for extended periods of time at supersonic speed without requiring afterburners.

If you want to learn more about what America’s failure to invest in the full complement of 750 F-22s means, read “The Fate of the Raptor,” originally published by Mark Helprin in the Claremont Review of Books in the Winter of 2009/10 and later appearing under a different title in the February 21st, 2010 edition of the Wall Street Journal. Abandoning the F-22 in order to produce the marginally cheaper F-35, a multi-use, far less sophisticated fighter that barely qualifies as a 5th generation aircraft, is a decision that is almost inexplicable. An Air Force source told me the real reason Washington chose the F-35 was political – the parts for the F-35 are manufactured in nearly every State, meaning a lot of Congressmen and Senators protected jobs in their districts. But the gains to a broader assortment of local economies is more than offset by the overall loss to our national economy, as we deploy an inferior weapons system, and regress technologically as we dismantle the F-22’s manufacturing lines.

When discussing preferable ways to engage in deficit spending, of course, this isn’t just about the F-22. This isn’t even just about strategic military spending – although our government’s failure to deploy the F-22 in numbers, and our failure to-date to launch a long-lead 6th generation fighter program, is an egregious case of missed opportunity. But missed opportunities abound. Along with 5th and 6th generation fighters, if we are to legitimately embrace Keynes during this economic downturn, we should be sending humans back to the Moon, and launching a manned Mars mission. The benefits to our technological prowess and industrial base alone justify these expenditures.

Back down on the earth, if deficit spending is indeed our economic elixir, we should be engaging in responsible development of domestic fossil fuel reserves and building nuclear power plants. We should be constructing desalination plants, canals and reservoirs (above and below ground), and we should be building and upgrading our bridges and freeways. All of these projects could be public-private partnerships, and could rely on deficit spending. But along with the temporary economic stimulus they would bestow, they would provide sustainable economic returns in the form of effective military deterrence, ongoing technological leadership, and assets of infrastructure that would yield permanently cheaper energy, water and transportation.

Instead, today we have interpreted Keynes at his worst, perverting his principles to justify massive deficit spending only to allocate money to public sector employee paychecks and pensions – borrowing and taxing and running up trillions in deficits not to invest in our future and our security, but to perpetuate their over-market, unsustainable compensation packages. If someday the U.S. can no longer deter her rivals, and faces another catastrophic war of uncertain outcome, remember 2009, the year the U.S. President killed the F-22 program to instead use Keynesian debt to pay government workers to live the life to which they had become accustomed. Similarly, when these never-ending, ever-expanding debt bubbles burst and utterly refuse to reflate, remember what returns might have accrued if we had invested those deficits to rebuild our nation, our technology, and our security, instead of feeding the insatiable maw of a unionized government.

Funding Social Security vs. Public Pensions

In a previous post “Social Security vs. Public Pensions,” source data is presented to document the following reality in America today: Given a similar salary history, a non-safety public sector employee will collect a defined benefit pension approximately triple what they would have collected under social security, and a “safety” public sector employee will collect a defined benefit pension approximately 4.5 times what they would have collected under social security. This post is to explore how feasible it is to fund social security vs. public sector pensions.

As will be shown, the notion that social security is on the verge of insolvency, or will ever be on the verge of insolvency, is complete nonsense. In stark contrast, however, based on quantitative facts that are relatively easy to extract and analyze, public sector pensions are glaringly unsustainable and they are already grossly insolvent. To compare public sector pensions to social security in order to justify federal deficit spending to bail out public sector pension funds – rather than dramatically reduce their benefit formulas – is entirely fraudulent. Here’s how we get to these sweeping conclusions:

The social security fund has been described as a “ponzi scheme,” suggesting that it can only remain solvent if the new entrants who work and pay into the system fund the retiring beneficiaries who collect payments from the system. But this ponzi scheme metaphor quickly breaks down. First of all, a ponzi scheme typically implies an eventual return of principal to the investors, whereas social security only promises a defined – albeit modest – retirement annuity. Therefore if the people entering the system as workers can provide sufficient cash to fund the retirees who are collecting from the system, there is no danger of insolvency. You can call this a virtuous ponzi scheme, or abandon the metaphor altogether. It isn’t really a valid metaphor.

The valid concern about social security is based on the possibility that as the American population ages, the ratio of workers to retirees will inevitably drop, as baby boomers age and as average lifespans increase. But if the data is examined critically, this concern, at least in America, is overstated.

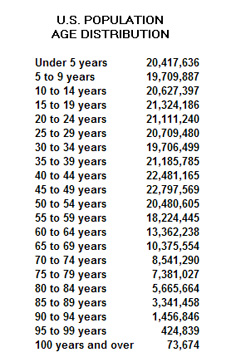
According to information found on the U.S. Census Bureau’s table “National Population Age Estimates,” summarized on the above table, there is clearly a large number of Americans who are about to become senior citizens, and consequently the number of senior citizens in America is going to nearly double over the next twenty years. But this data shows something else quite encouraging – the American age demographic is not about to invert, wherein the number of old people begins to significantly outnumber the number of young people. Remarkably, when examining each five year age group in America, nearly every one of them, from those under five years old through those in the 55 to 59 year age category, have almost exactly twenty million people. This not only demonstrates conclusively that America’s age demographic is simply transitioning from a pyramid to a column, and not inverting, but that it is easy to project retirement populations well into America’s future. Such an even stream of population age groups ascending America’s age continuum is a serendipitous reality – our age demographic is not inverting, it is normalizing – we are achieving a stable and sustainable population. To understand what this means for social security and public sector pensions, examine the next table (numbers are in thousands):

Using information from the U.S. Census Bureau’s table “Projections of the Population by Selected Age Groups for the United States: 2010 to 2050” (ref. 2nd link), and making some assumptions based on the earlier data that indicates an even stream of aging Americans – i.e., about 20 million people in each five year age group – it is reasonable to infer the above projections. That is, there are currently about 93 million Americans who have not yet entered the workforce, there are 137 million Americans between 22 and 54 years old, 40 million between 55 and 64 years old, and 40 million who are 65 years old or older. Using the same data, inferences can also be made for 2030 and 2050. As the table indicates, the population of all age groups increases over the next 20 to 40 years, with the largest increase among the 65 and older group. But the table also shows the number of people over 65 remains relatively stable between the years 2030 and 2050, which reflects the encouraging fact that Americans are replacing themselves, unlike many other developed nations.

The data to project the total number of full-time workers in America is derived from the U.S. Bureau of Labor Statistics “Occupational Employment Projections 2008” table, indicating there are 151 million workers in the U.S. currently, or about 85% of the working age population. The number of government workers in America is derived from U.S. Census Bureau data, adding up their reported Federal, State, and Local tallies, and indicates there are 19 million public sector workers in the U.S. today. Using subtraction, the above table infers there are 132 million private sector workers in the U.S. today. It is important to note that in the context of calculating the solvency of social security vs. public sector pensions, 19 million public sector workers is a very conservative number, because it doesn’t include career military personnel, nor does it include millions of public utility workers who often enjoy retirements outside of social security, calculated instead using the same formulas as public sector pensions.

Based on the percentage of active public sector workers vs. private sector workers – adding one key assumption, that the ratio of government workers per capita has gone up 50% in the past 40 years – the 2010 retirement populations of government workers and private sector workers are also inferred on the above table. In reality, the 2010 numbers are not crucial, because it is the future solvency that is of concern. In this, the numbers are again quite conservative, because they assume the ratio of public employees vs. private sector employees remains constant, i.e., 11% of the working age population work for the government, and 74% of the working age population work in the private sector. Assuming the public sector workers retire on average at age 55, and the private sector workers at age 65, by 2050, the number of retired private sector workers will double, while the number of public sector workers will nearly triple. This disparity is explained based on two differentiating factors – the increase in government workers as a percent of the total workforce over the past generation, along with the earlier retirement of government workers compared to private sector workers. But when this headcount disparity is combined with the huge financial disparity between public pensions and social security, there is a dramatic compounding effect, as shown on the next table.

Using data from the same sources referenced above, the average annual earnings of private sector workers in the U.S. is currently $29K per year, and for public sector workers it is $52K per year. If one assumes these averages correspond to wage-earners at the mid-point of their career, which the even-streamed (neither pyramidal nor an inverted pyramid) age demographic of the American workforce does suggest, then the average earnings of someone in their final year of employment can be inferred using the Social Security Administration’s “Benefit Calculator’s” (ref. item 4) “relative growth factor” of 2.0%. That is, the average worker receives an increase to their earnings, after inflation, of 2.0% per year (all figures here are using 2010 dollars, which is to say they are real, or after-inflation figures). To estimate the final salary of a private sector worker, their average salary is multiplied by 1.02^20, implying a 40 year career, and for the public sector worker, their average salary is multiplied by 1.02^15, implying a 30 year career. From these inputs, the conclusions fall out via simple arithmetic, and they are staggering.

Right now, using these assumptions, our 5.8 million public sector retirees, representing 14% of the retired population, collect $245 billion in retirement pensions, whereas social security recipients, representing 86% of the retirement population, collect $553 billion in social security payments. The average social security payout is based on the Social Security Administration’s “Estimated Retirement Payments Chart,” applied to the projected average final salary of a private sector worker – using the average final salary (social security formulas are progressive, unlike public sector pensions, meaning the less you make, the higher percentage of your final salary you will receive in social security), this equates to $15K per year, or 34% of their final salary. The average public sector employee’s retirement pension payout is based on 2% per year times a 30 year career, applied to their projected average final salary – this is $42K per year, or 60% of their final salary.

Adding this all up, the ratio of total private sector payroll to total social security payouts is quite interesting in 2010 – at 14%, it suggests that social security today is breaking even, since 14% is what employers and employees together are currently contributing to social security. In turn, when looking at 2030 and 2050, the ratio of total social security payments to total private sector payroll does go up – but only to 22%, and it stabilizes there, reaching that level in 2030 and not increasing at all between 2030 and 2050. For social security to remain solvent in 2030 and beyond, the employer and employee contributions to social security will need to increase by 4% each, from 7% to 11%. Alternatively, the $104K cap on social security withholding can be raised, or there can be means testing, or other slight reductions to social security benefits, or there can be a slight increase to the age at which a worker becomes eligible for social security. Or a combination of all of these. The point is this: Social security can remain solvent with relatively minor and incremental tweaks. Social security is not about to go insolvent, and it never will.

When one examines public sector pensions, however, the opposite is painfully evident. Estimated total public sector pension payouts already are 25% of total public sector payrolls. By 2030 they will be 57%, and by 2050 they will be 62%. Equally dramatic is the projected absolute dollar amount that will be paid out in public sector pensions in comparison to social security – by 2030 social security will pay out $918 billion and public sector pensions will pay out $620 billion – 67% as much money for 24% as many people – and by 2050 social security will pay out $1.1 billion and public sector pensions will pay out $796 billion – 72% as much money for 25% as many people. At the rate we are going, public sector pensions, serving less than 20% of all retired Americans, are going to cost American taxpayers nearly the same amount in absolute dollars per year as social security payments, serving the other 80% of Americans. This is grotesquely unfair and ridiculously unsustainable. To compare social security, which can easily remain solvent, with public sector pensions which are already insolvent and are headed for utter collapse, is completely absurd.

Defenders of public sector pensions point out the fact that public sector pensions are invested, and therefore yield investment returns, which therefore compensates for what would otherwise be their financial shortcomings. Problems with this argument abound – first because pension funds will not generate the returns in the future that they generated in the past – read Pension Funding and Rates of Return, The Razor’s Edge – Inflation vs. Deflation, Pension Rhetoric vs. Pension Reality, Sustainable Pension Fund Returns, California’s Personnel Costs, Maintaining Pension Solvency, and Real Rates of Return, to name a few, to understand why the public employee pension funds have been overestimating how much they can earn on their funds. But more fundamentally, why are public employees entitled to see their pension fund contributions invested into the private sector, when private sector employees see their social security contributions held in a zero-interest trust? You can argue which is better or worse – I would suggest it is dangerous, for a variety of reasons, to throw this much money into passive private sector investments and that all taxpayer supported retirement annuities should be self-funded via current collections (the virtuous ponzi scheme) – but whatever one may conclude, there is no reason taxpayer funded retirement accounts should not be managed in the same manner for all Americans.

If you have waded through all these numbers, it is important not to miss the point. Social security and public sector pensions are not similar at all. The challenges facing social security are easy to address, whereas the challenges facing public sector pensions are dire, and cannot be solved unless either dramatic benefit cuts are implemented or massive tax increases are enacted. In the interests of the financial security and economic future of America, if not in the interests of equity in retirement for all American workers, the choice between benefit cuts vs. tax increases should be obvious.

Who Are The Carbon Criminals?

At first glance, one might think “Carbon Criminals” is meant to describe the people who extract carbon-based fuel, sell it to the public at a competitive price, and in the process, allegedly edge the planet towards a catastrophic environmental collapse. But perhaps one would be wrong.

There’s nothing wrong with questioning our inordinate dependence on fossil fuel, or taking measures to improve the process of extracting and burning fossil fuel in order to protect our environment. To fail to regularly and scrupulously upgrade safety procedures from top to bottom, throughout the fossil fuel industry, may indeed be considered criminal. And as our technology improves and our prosperity enables us to do more, it is arguably criminal to fail to make the burning of fossil fuel a cleaner proposition each and every decade. But the real criminals are not the industrialists who have made carbon based fossil fuel the engine of civilization – the real criminals are the faceless bureaucrats and cynical opportunists who have convinced us we have to auction and trade carbon emissions allowances and carbon offset credits.

Most people still haven’t thought about how this entire scheme is going to work. And even those who have given this considerable thought, such as the bureaucrats at the California Air Resources Board, are often still in the dark on the details. Read their “Scoping Plan,” and draw your own conclusions as to their readiness to dramatically transform our economy, our property rights, and our lifestyle. Here’s a few of the concepts that need to be mastered, then applied into law, in order for “carbon trading” to become a reality:

(1) Emission Allowances – this is a permit that will be sold by the government to any business that emits more than 25,000 tons of CO2 per year. This would be all power utilities, large manufacturers, and most large agribusinesses, to name a few. These permits would have an initial price, still to be determined, that the State would collect from these businesses in order for them to continue to emit CO2 “pollution.” How are these emissions calculated? Some variables are relatively straightforward, such as smokestack emissions. But it won’t end there. Dozens of “CO2 equivalents,” such as the methane emitted from dairy farms, other livestock operations, and even the flooded fields of rice growers, and on and on, will also have to be measured and calculated. This becomes a very subjective, and very expensive procedure. But don’t worry, State approved consultants will be available to perform this calculation.

(2) Carbon Trading – this is the procedure whereby businesses that have failed to reduce their CO2 emissions would buy permits from other businesses who have managed to reduce their CO2 emissions by more than necessary. This is supposed to “put the market to work,” and indeed, it will put a lot of brokers and IT professionals to work, along with armies of attorneys and accountants. As the value of an emission allowance drops each year – so we can supposedly ratchet down our collective CO2 emissions to prehistoric levels within a few decades – companies will have the opportunity to purchase emissions allowances and “offsets” from qualified sellers, in order for them to continue to emit CO2. Alternatively, they can invest money in non-CO2 emitting sources of power – wind power, methane digesters, etc.

(3) Carbon Offsets – these are projects designed to sequester carbon or reduce carbon. A new forest that sequesters carbon in the wood of the trees. A renewable energy project that emits zero carbon. A methane harvester that captures the methane that bubbles up from a waste water pond at a dairy farm, or out of a landfill. To the extent these projects reduce annual CO2 emissions, they are eligible to sell these “offsets” to people who need more permits to emit CO2.

(4) “Additionality” – oops, don’t try to sell a carbon “offset” if you were going to build that zero CO2 emitting hydroelectric dam anyway, or if you were going to reforest your timber property anyway. For that matter, if the price of electricity gets high enough to justify any non-CO2 emitting source of energy, solar, wind, on strictly financial grounds, meaning that you would have built it anyway, then it no longer qualifies as an “offset” project, because it no longer meets the essential criteria of “additionality.” No subjectivity there.

If you don’t accept the premises being used to justify all this – that CO2 is a deadly gas, that fossil fuel is nearly depleted – than it is easier to see what a magnet this whole scheme is for white collar criminals – and their deadly counterparts in the underworld. But even if you do believe carbon is something we need to wean ourselves of, if you ponder the level of corruption that implementation will breed, you may have second thoughts. And as food for 2nd thoughts, consider these articles – just the tip of the iceberg – that describe the ongoing exploitation of the carbon scare by criminal elements:

Deutsche Bank, RWE Raided In German Carbon Fraud Probe

Carbon Trading Complexity Putting Strains on Market Reputation

Anti-fraud investigators swoop on EU emissions traders

U.N. panel suspends two more carbon emissions auditors

Spain Police Arrest Nine In CO2 Tax Probe

Carbon market chaos strikes again

Scandal brewing in the Euro carbon credits market

CDM crackdown continues as board rejects fresh Chinese wind projects

Carbon Credit fraud causes more than 5 billion euros damage for European Taxpayer

That green energy scandal

British carbon traders charged with money laundering relating to alleged carousel fraud

It is difficult to read these stories, all recent, all from reputable sources, without feeling a tremendous apprehension for our future. There is a Citizen’s Initiative, the California Jobs Act, slated for the November 2010 ballot that will suspend implementation of California’s 2006 Global Warming Act, set to take effect in 2012. When the opponents of this measure pull out all the stops, accusing proponents of being shills for “big oil” (despite the fact that most oil companies have come around, and plainly see the dollar signs inherent in embracing the whole global warming scheme), remember who they are: high-tech moguls who want to build the surveillance devices that will manage every kilowatt we use and every mile we drive, public sector bureaucrats and white collar professionals who see the biggest new source of revenue since the enactment of the federal income tax nearly 100 years ago, and, of course, the Wizards of Wall Street, who will milk this for billions upon billions. For more, read “Implementing California’s Global Warming Act.”

Who are the real carbon criminals?

Social Security Benefits vs. Public Pensions

When discussing the issue of public employee pensions, it is easy to suggest that these pensions are necessary because public employees usually don’t earn a social security benefit. While this is true, it ignores the startling disparity between the value of a social security benefit and the value of the typical public employee pension. And it isn’t hard to make the comparison.

If you go to the Social Security online “Estimated Social Security Retirement Benefit” table, you will see what you may expect to receive from social security when you retire, based on how much you earned in your last year working. A person making $65K per year, retiring on their 66th birthday, will begin to collect a monthly social security benefit of $1,609, or $19,308 per year.

In California, public employee pensions typically are calculated based on how many years the employee works, times a set percentage that usually ranges between 2.0% and 3.0%. As an example of how this would work, here are some apples to apples comparisons with social security, i.e., a public employee who enters the workforce at age 22, works for 44 years, makes $65K per year, and retires on their 66th birthday. At a 2.0% per year pension factor – which is the low end of the scale for public employees – this person will qualify for a pension equivalent to 88% of their final salary, based on 2.0% per year times 44 years worked. This equates to a monthly benefit of $4,766, or $57,200 per year.

Using the same assumptions – the same number of years working, and the same earnings during their years working – the 2.0% per year benefit will provide a public employee with a retirement income that is nearly three times better than what a private sector social security recipient will receive.

The high end of the pension benefit scale for public employees is reserved for those engaged in high-risk occupations such as police officers, correctional officers, and firefighters. While according to CalPERS own actuarial data, these individuals actually, on average, have lifespans slightly longer than the average worker – the theory is they live somewhat longer because they retire earlier and endure less financial stress – there are nonetheless compelling reasons why people who are first responders and take risks to safeguard the rest of us should earn a premium for this. The question is how much of a premium is appropriate.

A public safety employee who enters the workforce at age 22, works for 44 years, makes $65K per year, and retires on their 66th birthday – earning a 3.0% per year pension factor – will qualify for a pension equivalent to 132% of their final salary, based on 3.0% per year times 44 years worked. This equates to a monthly benefit of $7,150, or $85,800 per year, a retirement income 4.5 times better than what a social security recipient would earn after working the same number of years and earning the same amount of money.

There are countless nuances to this – public employees generally retire earlier than age 66, for example, which means they don’t qualify for as high a benefit as the comparisons made here would indicate. But early retirement also means fewer working years to set aside funds for the retirement benefit, and who doesn’t want to retire early? Many retired public employees who are still in their early 50’s collect pension incomes well in excess of social security, and are young enough to embark upon lengthy second careers.

Defenders of the public employee pension benefit – which is between 3.0x and 4.5x better than the social security benefit – claim there is little cost to the public for this disparity because most of the funds necessary to pay for this benefit are proceeds from investments by public employee pension funds, and not the burden of the taxpayer. There are several serious problems with this argument.

As argued in-depth with earlier posts, including Pension Funding and Rates of Return, The Razor’s Edge – Inflation vs. Deflation, Pension Rhetoric vs. Pension Reality, Sustainable Pension Fund Returns, California’s Personnel Costs, Maintaining Pension Solvency, and Real Rates of Return, the public employee pension funds have been overestimating how much they can earn on their funds. CalPERS still has an official projected rate of return of 4.75% after inflation. In the long term, it is unlikely CalPERS, or any other pension fund with hundreds of billions of invested assets, can earn an inflation-adjusted annual return of more than about half that. And if your fund earns half as much per year, without splitting hairs, it is roughly accurate to say your annual contribution rate to that fund has to double, in order for these defined retirement benefit promises to be met. This painful readjustment is happening now, and is one of the primary reasons our cities and counties are sliding into bankruptcy.

Another problem with this argument is the implication that investments of taxpayer sourced funds should yield returns to public employees, but not to taxpayers. Why are public employee pension funds pouring money into speculative investments, and showering the benefits of those investments onto the public sector workforce when the returns are good, then holding the taxpayer accountable to make up the difference when the returns are bad?

There’s more: Why are these quasi-government entities, using taxpayer’s money, being permitted to own shares in private sector corporations in the first place? Why aren’t more restrictions placed on the influence public employee controlled pension funds have on our corporations through becoming major shareholders? Isn’t this just another subtle but significant government encroachment on private property?

It’s important to note that the disparity between public sector pensions and social security is only one glaring example of the disparity in overall compensation between the public sector workforce and the private sector taxpayers. In most cases, public sector employees now make more in base pay than their counterparts in the private sector who have similar skills. They also receive more vacation time, sick leave, personal days, “comp” time, job security, annual cost-of-living increases, medical benefits, retirement medical benefits, auto allowances, low-interest loans, and more. The pension examples cited here, by the way, are conservative – they don’t take into account pension “spiking,” or the commonplace practice of fraudulently claiming additional disability benefits in retirement. There is a staggering cost for all this. The idea that we can continue to increase benefits to government employees, and finance this through increased indebtedness and higher taxes, is utterly unsustainable and morally bereft.

Ultimately the problem with public sector pensions goes beyond issues of financial sustainability, and like the entire compensation package public sector employees enjoy, becomes a question of fairness. For economic reasons, but also to be fair, the solution to government deficits is to lower the base pay and benefits to all public employees across the board.

* * *

* * *